
Market Making and the Bid-Ask Spread, Explained for Beginners
What a market maker does, how the bid-ask spread and order book work, how market makers earn and lose, and how spreads affect your own trading costs.
StockYatra Team18 Oct 2026
Learn to trade, step by step
Nepal, India and US boards, live
Calculators and charts for every trade
Learn alongside other traders
One account on phone and web
The fundamentals for beginners: charts, indicators, demat accounts, IPOs and courses.
What a market maker does, how the bid-ask spread and order book work, how market makers earn and lose, and how spreads affect your own trading costs.

Compare high-frequency, algorithmic and manual trading: who decides, speed, holding time, costs, skills needed, and which one a beginner should actually learn first.
High-frequency trading explained: latency, co-location, market making and arbitrage, who does HFT, the risks and rules, and what it means for retail traders.
Algorithmic vs manual trading compared: discipline, speed, testing, adaptability, costs and risks, plus a hybrid approach that suits most beginners.

Algorithmic trading explained: how rules become orders, the main types of algos, the rules in India, Nepal and the US, the risks, and how to practise free.

What AI and machine learning can and cannot do in markets: why short-term prices are mostly noise, where AI helps, and how to use AI tools sensibly.

Black box AI trading explained: how hidden-logic algorithms turn data into buy and sell signals, where they are used, their limits, and how to judge one.

StockYatra's Academy now has 157 courses and 517 lessons in English, Nepali and Hindi, from foundations and orders to technical analysis, fundamentals, risk and derivatives. Free to start.
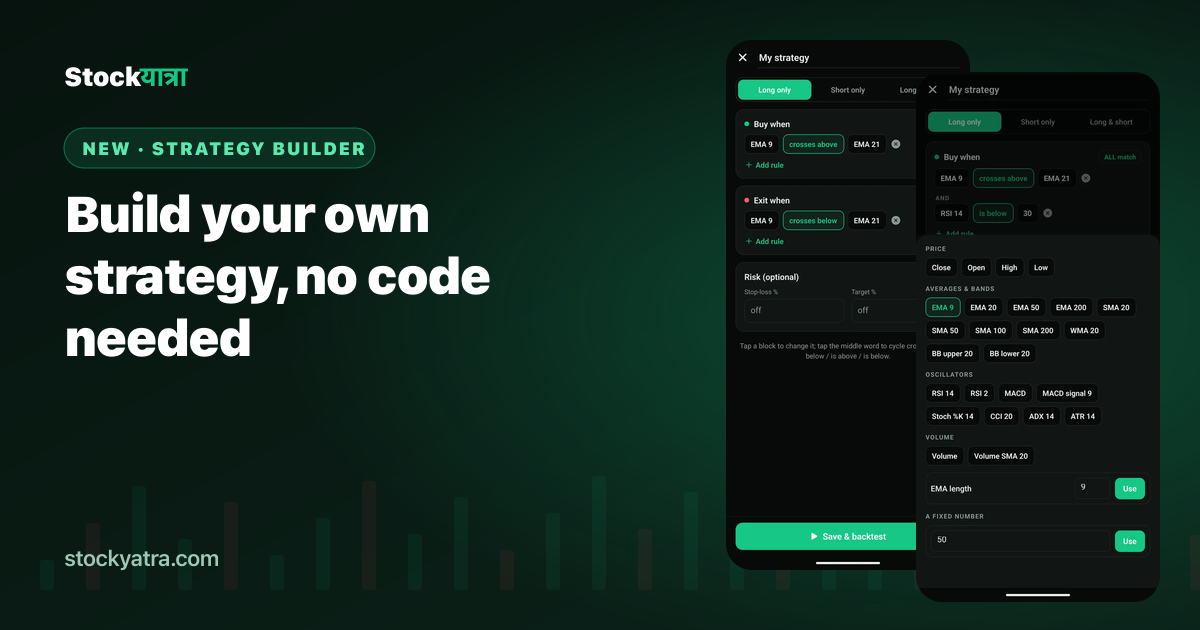
Turn a trading idea into rules like "EMA 9 crosses above EMA 21" or "RSI below 30", add a stop-loss and target, and backtest it on any stock in StockYatra, free and with no code.
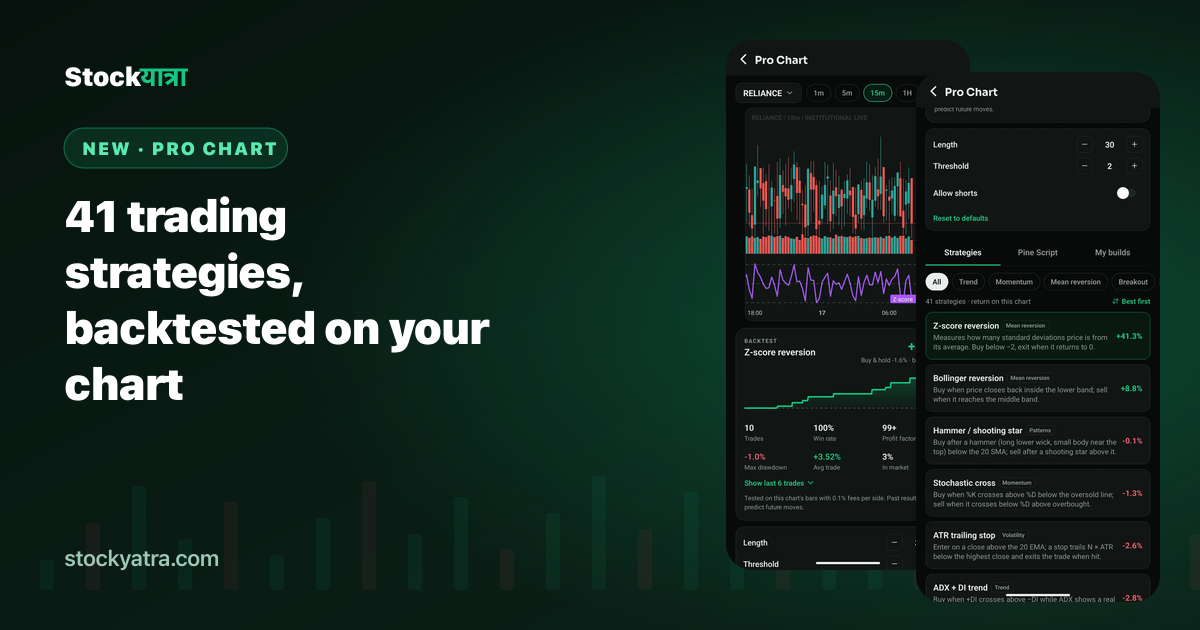
StockYatra Pro Chart runs 41 classic trading strategies on NEPSE, NSE and US stocks and shows a full backtest with fees: return vs buy and hold, win rate, profit factor and drawdown.
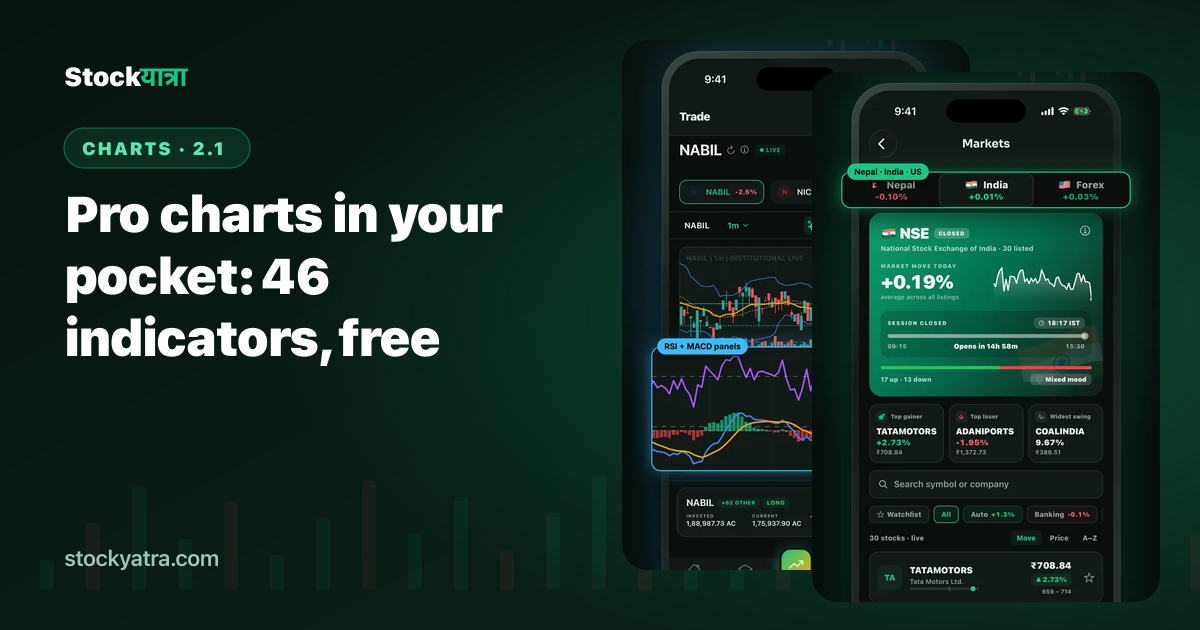
StockYatra 2.1 brings pro charts to your phone: 46 indicators, RSI and MACD panes, hollow candles, Renko, line break and OHLC bars, plus a full-screen order ticket.

Candlestick, hollow candle, OHLC bar, line, Heikin Ashi, Renko and line break charts compared: how each is built, what it is good at, what it hides, and when a beginner should use it.

What a moving average is, how a simple (SMA) and exponential (EMA) moving average differ, how to pick a length, what golden and death crosses are, and why crossovers fail in sideways markets.
A plain-language guide to RSI and MACD: how each is calculated in principle, how to read overbought, oversold, crossovers and divergence, and the market conditions where both give bad signals.
What support and resistance are, why they work, how to draw them as zones, what happens when they break, and the mistakes beginners make. Worked examples with simple round numbers.
Learn to read candlestick charts step by step: open, high, low and close, bodies and wicks, timeframes, candles in groups, volume, and the mistakes beginners make. With free charts to practise on.

Track open and upcoming Nepal IPOs, FPOs, right shares and mutual funds in StockYatra, then apply on Meroshare step by step and check your IPO result.
StockYatra has 117 stock market lessons, each with a short explainer video in Nepali, English and Hindi, plus quizzes and practice with virtual coins. Free.

Swipe short stock market videos in Nepali, English and Hindi: help videos, lesson explainers and creator clips. Like, comment, share and save, all free.

Accountability, explaining your reasoning, seeing other styles and honest journaling: why traders improve faster together, and how to build the habit for free.

The best app to learn the stock market blends short courses, quizzes and hands-on practice. Here is what to look for — and how StockYatra teaches by doing, free.

Want to practise share trading in Nepal without risking money? Use a free paper trading app to drill NEPSE order placement, stop-losses and strategy before you open a Demat account.
Moving averages smooth price into a trend line. Learn SMA vs EMA, common periods like the 50 and 200-day, and how crossovers signal trend changes.
Fundamental analysis asks what to buy; technical analysis asks when. Learn how each works, their pros and cons, and how traders combine both.

An IPO is a company’s first sale of shares to the public. Learn how IPOs work, how to apply (including via Mero Share in Nepal), and how to evaluate one.
A Demat account holds your shares electronically. Learn what it is, why you need one, the documents required, and how to open a Demat account step by step.
Learn how to read stock charts step by step: price and time axes, candlesticks, timeframes, volume, trend, and support & resistance — with clear diagrams.
A beginner’s guide to the three most popular technical indicators — moving averages, RSI and MACD. Learn what each measures and how to use them.
A trading journal turns random trades into a feedback loop that makes you better. Learn what to record, how to review it, and templates to start today.
Support and resistance are the most useful levels on any chart. Learn how to spot them, why they form, and how to trade bounces and breakouts with confidence.
Learn to read candlestick charts: what a candle shows, plus 8 essential bullish and bearish patterns — doji, hammer, engulfing and more — with clear examples.
Step-by-step guide to investing in the Nepal Stock Exchange (NEPSE): opening a Demat and Mero Share account, TMS, IPOs, and practising risk-free first.