In short
- Pro Chart is in the StockYatra app's side menu, free for every member.
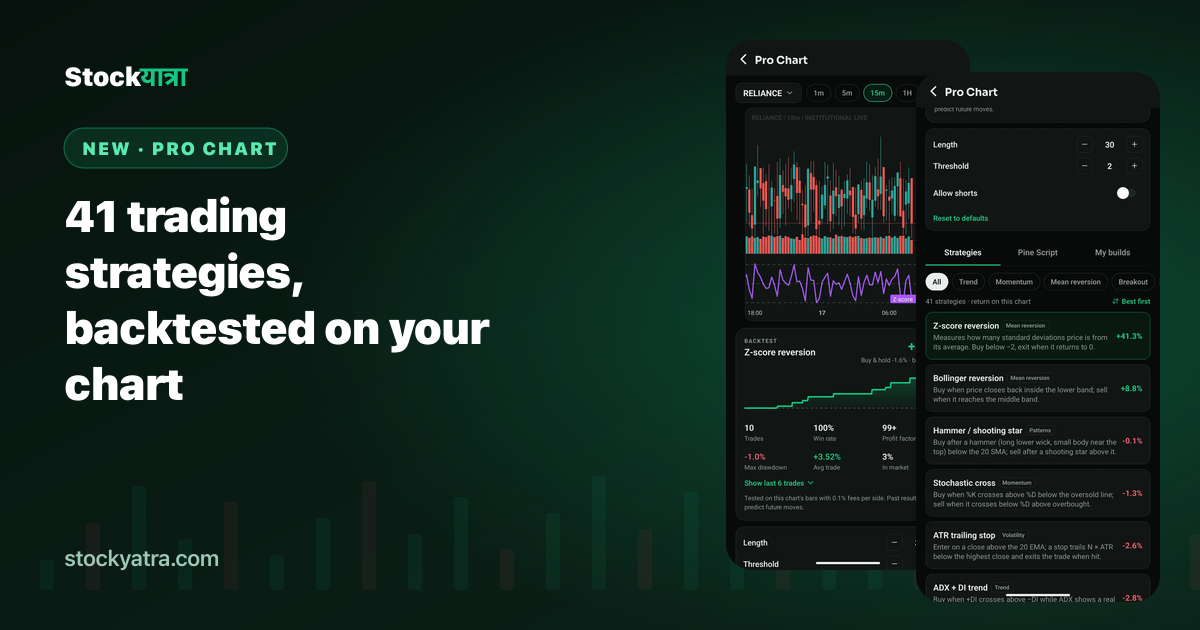
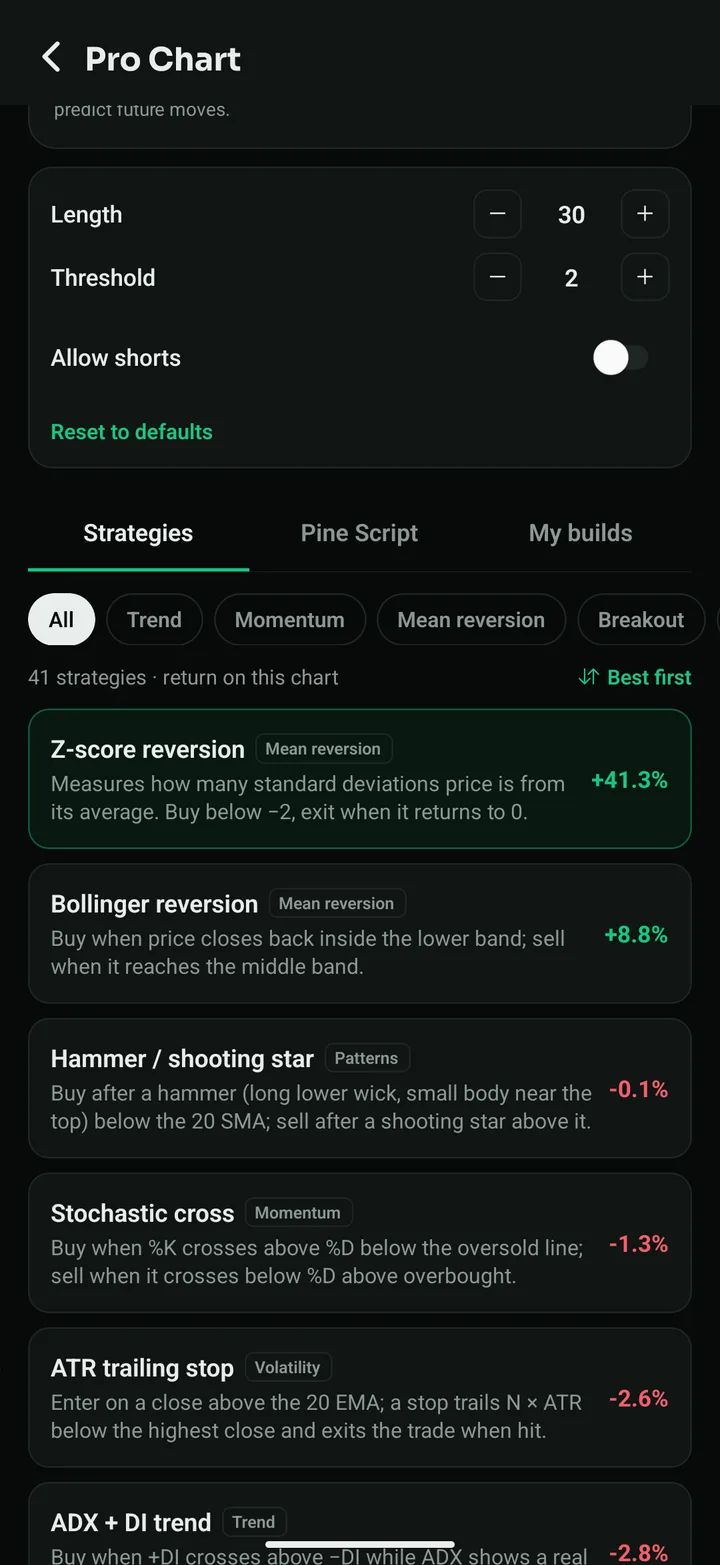
- 41 prebuilt strategies in seven groups, each drawn on the chart with Buy and Sell arrows.
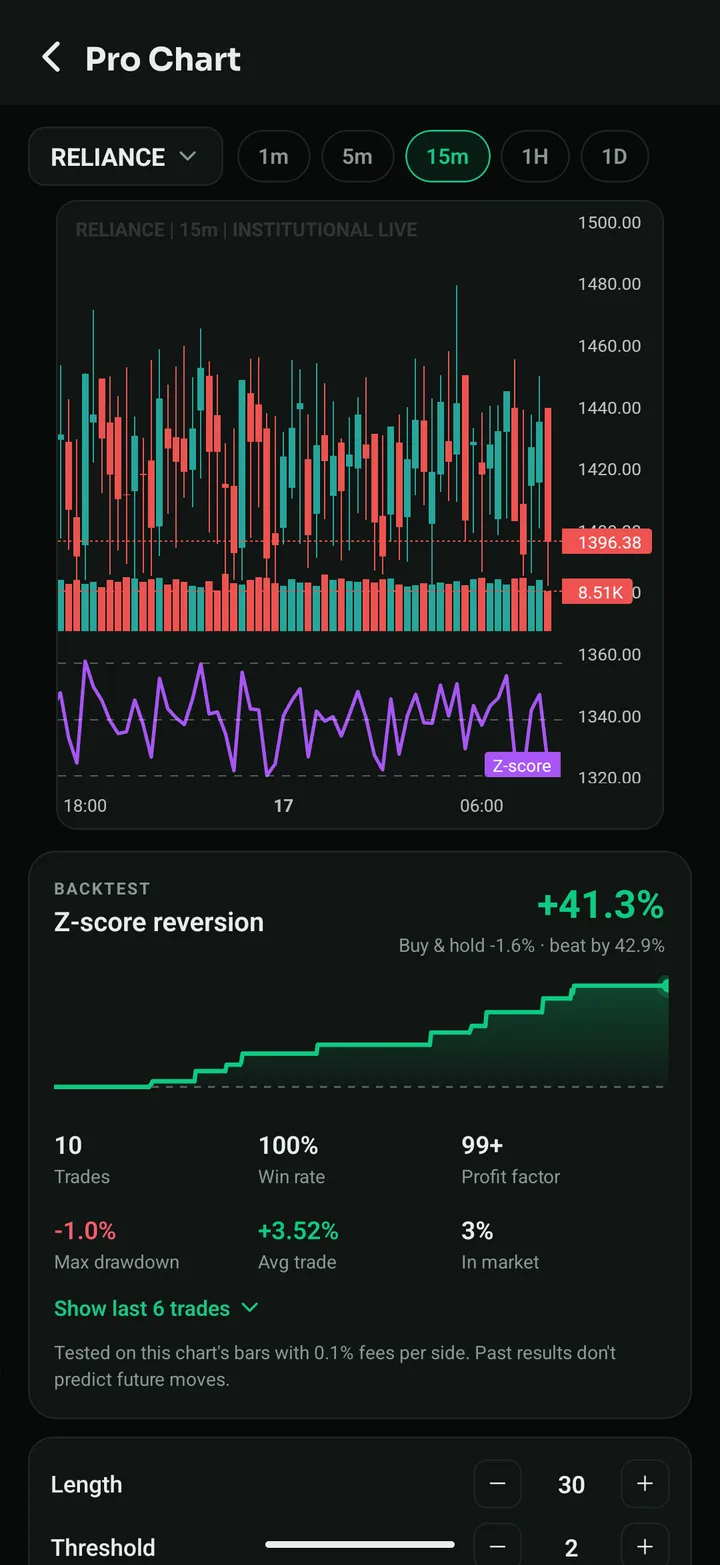
- A backtest card under the chart: return vs buy and hold, win rate, profit factor, drawdown, average trade and time in market, with 0.1% fees per side.
- Change settings with steppers, switch shorts on or off, and sort the list by what did best on this stock.
- A backtest describes the past. Use it to understand how rules behave, not as a signal.
Every trader has ideas: "buy when the fast average crosses the slow one", "sell when RSI is overbought". The honest question is how would that idea have actually behaved? Until now, answering it meant a desktop and a paid tool. Pro Chart answers it on your phone, on practice money.
How to use it
- Open the side menu and tap Pro Chart.
- Tap the symbol to choose any NEPSE, NSE or US stock, then a time frame: 1m, 5m, 15m, 1H or 1D.
- On the Strategies tab, filter by group or sort by Best first to see which rules did best on this stock.
- Tap a strategy. Its indicators and arrows appear on the chart and the backtest card fills in.
- Adjust its settings with the − and + steppers, or switch on Allow shorts to let sell signals open short trades.
All 41 strategies
| Group | Strategies |
|---|---|
| Trend (11) | SMA crossover, EMA crossover, Triple EMA stack, Golden / death cross, Supertrend, Parabolic SAR flip, ADX + DI trend, Ichimoku TK cross, Heikin-Ashi trend, Hull MA slope, Aroon cross |
| Momentum (7) | MACD signal cross, MACD zero line, RSI 50 trend, Stochastic cross, Rate of change, TRIX signal, Momentum + trend filter |
| Mean reversion (7) | RSI 30 / 70, Williams %R, CCI ±100, Bollinger reversion, Z-score reversion, VWAP reversion, RSI(2) pullback |
| Breakout (5) | Donchian / Turtle, Keltner breakout, Inside bar breakout, NR7 breakout, Gap and go |
| Volatility (4) | Bollinger squeeze, ATR trailing stop, Chandelier exit, ATR range expansion |
| Volume (4) | OBV trend, Money Flow Index, Volume breakout, VWAP trend |
| Patterns (3) | Engulfing candles, Three soldiers / crows, Hammer / shooting star |
Each strategy has a one-line explanation in the app. The full descriptions are on the Pro Chart page.
Reading the backtest card
| Number | What it tells you | Watch out for |
|---|---|---|
| Net return | What the rule made on these bars after fees | One stock, one period: it may not repeat |
| vs buy and hold | Whether the rule beat simply holding | Beating a falling stock by losing less is still a loss |
| Win rate | Share of trades that made money | High win rates with tiny wins and big losses |
| Profit factor | Money won ÷ money lost | "99+" usually means very few trades |
| Max drawdown | Deepest fall from a high in the equity curve | Could you sit through that fall? |
| Average trade | Mean return per trade after fees | Small edges disappear with real costs |
| Time in market | How often a position was open | Less exposure can mean less risk |
Three traps to avoid
1. Tuning until it looks perfect
If you nudge the settings until the backtest shines, you have fitted the past, not found an edge. Try the same settings on three other stocks and another time frame. If it only works on one, it probably does not work.
2. Ignoring the number of trades
Fewer than about 30 trades is too small a sample to judge. Use a shorter time frame or a longer history to get more.
3. Forgetting costs
Pro Chart already charges 0.1% per side. Real brokers add their own part (commission, fees, slippage), which is usually higher for small orders. An average trade of +0.1% would not survive that.
Where to go next
Found a rule you like? Build your own version without code, or write it in Pine Script. Then practise it on the live practice market and check My Analysis after a week to see how you actually traded it.
Key takeaways
- 41 strategies, seven groups, all free in the app.
- The backtest includes fees and compares with buy and hold.
- Check the number of trades and the drawdown before the return.
- Test on several stocks before trusting a rule.
Summary in Nepali (नेपालीमा सारांश)
Pro Chart मा ४१ वटा प्रख्यात ट्रेडिङ रणनीति छन्। कुनै पनि NEPSE, NSE वा अमेरिकी शेयर छानेर रणनीति थिच्नुहोस्; चार्टमा Buy/Sell चिन्ह र तल पूरा ब्याकटेस्ट (फाइदा, जित दर, profit factor, drawdown) देखिन्छ। ब्याकटेस्टले विगत देखाउँछ, भविष्यको ग्यारेन्टी होइन।
Try Pro Chart free
StockYatra is free on the App Store and Google Play. Already installed? The October update arrives automatically the next time you open the app. You start with 10,000 free virtual coins; prices are simulated and coins are never real money.
More from the October update
- Everything new in the October 2026 update
- Pine Script in the StockYatra app
- Build your own trading strategy without code
- My Analysis: your trading report card
- Global chat is back
- 100 new courses in English, Nepali and Hindi
- Pro Chart: all 41 strategies
- Full changelog
StockYatra is an education app, not a broker or adviser. Prices on its practice market are simulated around each stock's real-world level, coins are virtual, and nothing here is a recommendation to buy or sell any security. Backtests describe the past and do not predict future results.