Technical indicators are calculations plotted on a chart to help you read momentum, trend and timing. You only need a few.
1. Moving averages (trend)
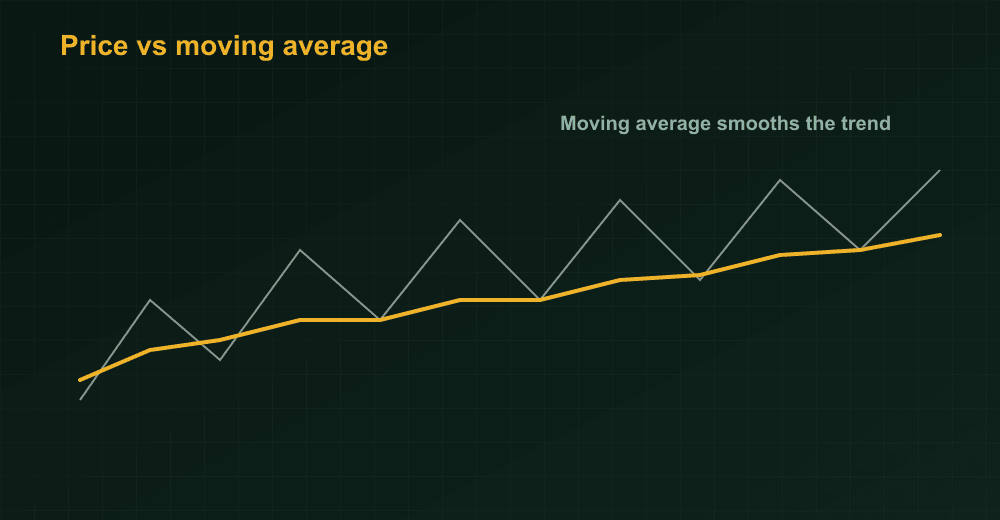
A moving average smooths price into one line, revealing the trend. A short MA crossing a long one is a “golden cross” (bullish) or “death cross” (bearish).
Key idea: Indicators are lagging by nature — they describe what price has already done. Use them to confirm, not predict.
2. RSI (momentum)
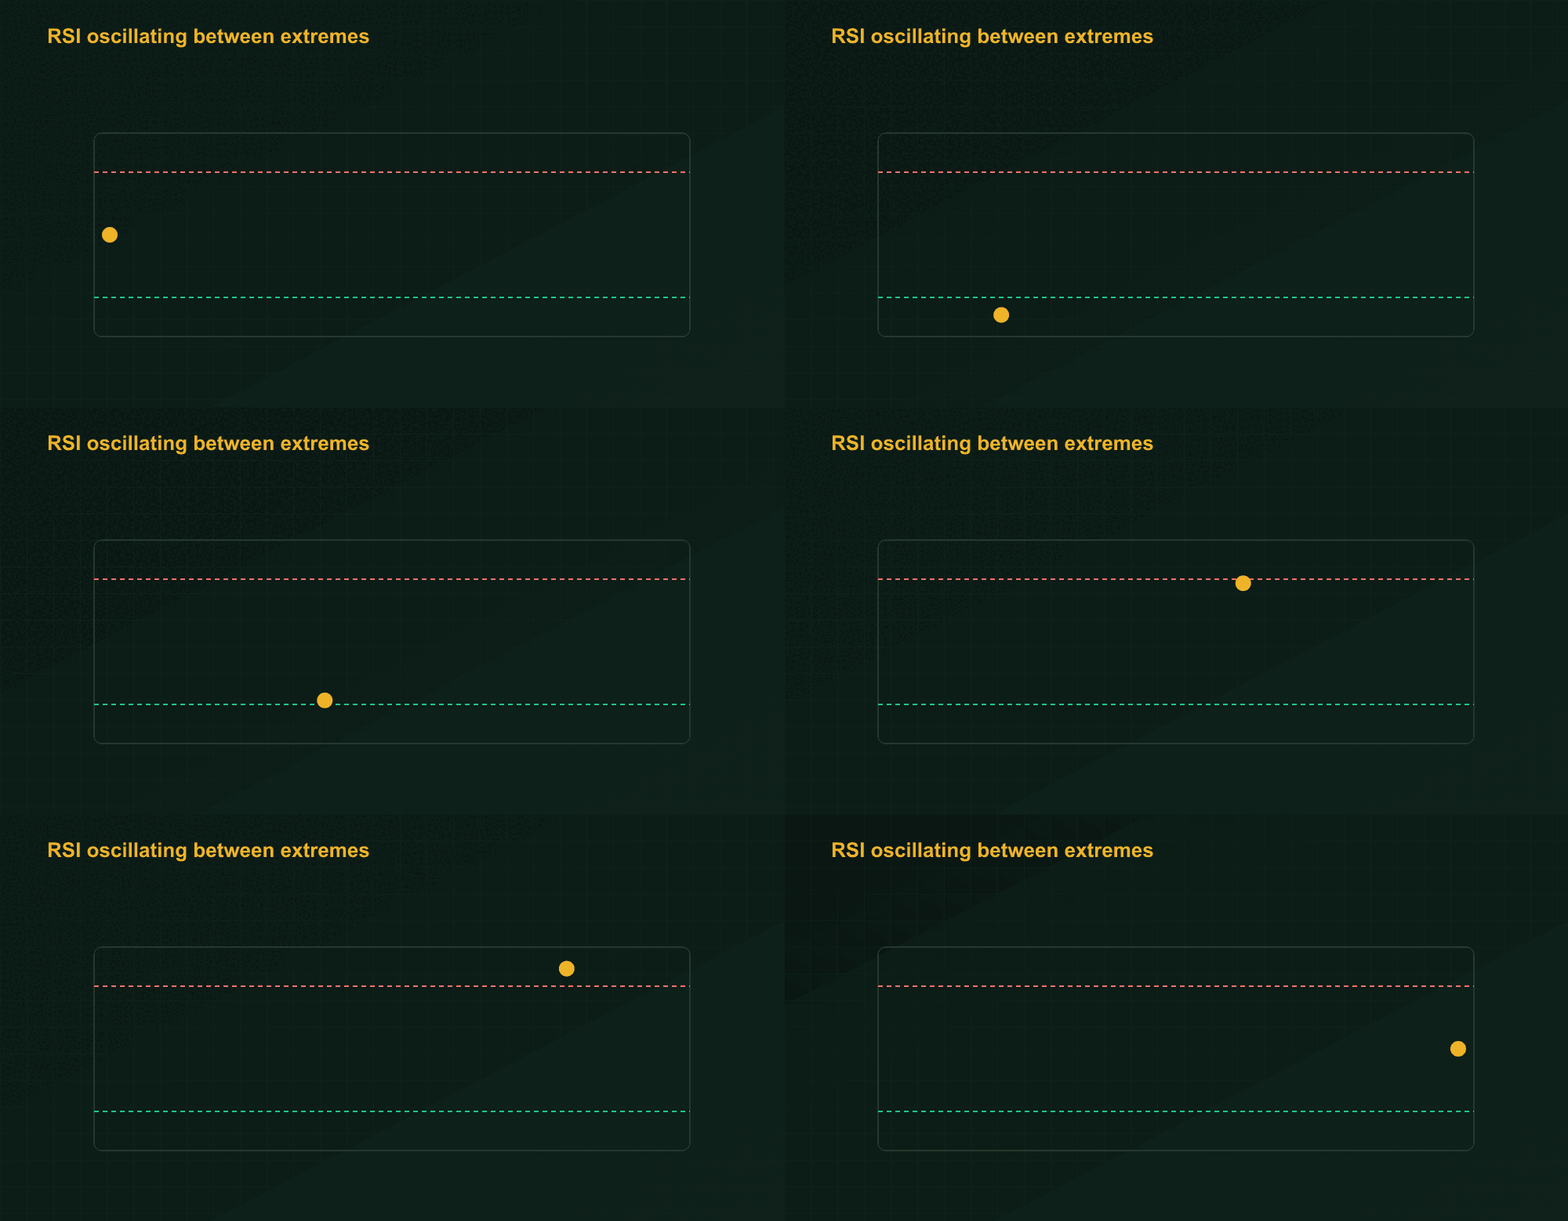
The Relative Strength Index runs 0–100. Above 70 is “overbought,” below 30 “oversold” — but in strong trends RSI can stay extreme for a long time.
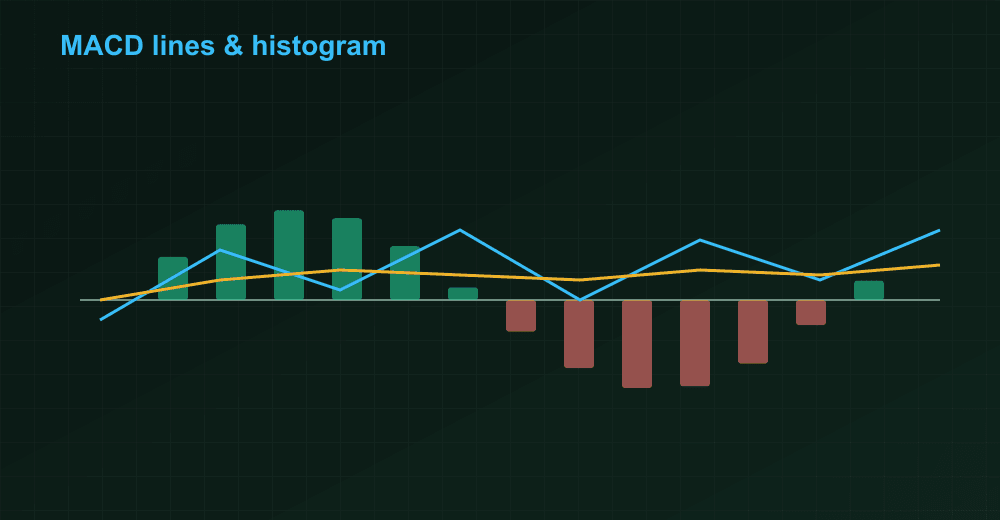
3. MACD (momentum + trend)
The MACD compares two moving averages to show momentum shifts, and is great for spotting divergence.
Don’t overload your chart
Pick one trend tool and one momentum tool, learn them deeply, and combine with price action.
Key takeaways
- Moving averages reveal trend; RSI and MACD read momentum.
- Indicators lag — confirm, don’t predict.
- Overbought/oversold are clues, not signals.
- Two well-understood indicators beat ten you half-know.
Practise this free on StockYatra
Open a free account, get 10,000 virtual coins and trade live-simulated NEPSE & Indian markets with zero real-money risk.