Test a trading idea before you risk a coin.
Pro Chart puts 41 prebuilt strategies, a no-code strategy builder and a Pine Script editor on your phone. Every run draws its signals on the chart and shows a full backtest: return against buy and hold, win rate, profit factor and drawdown.
- 41 strategies
- 7 strategy groups
- 15 Pine scripts
- Free on practice money
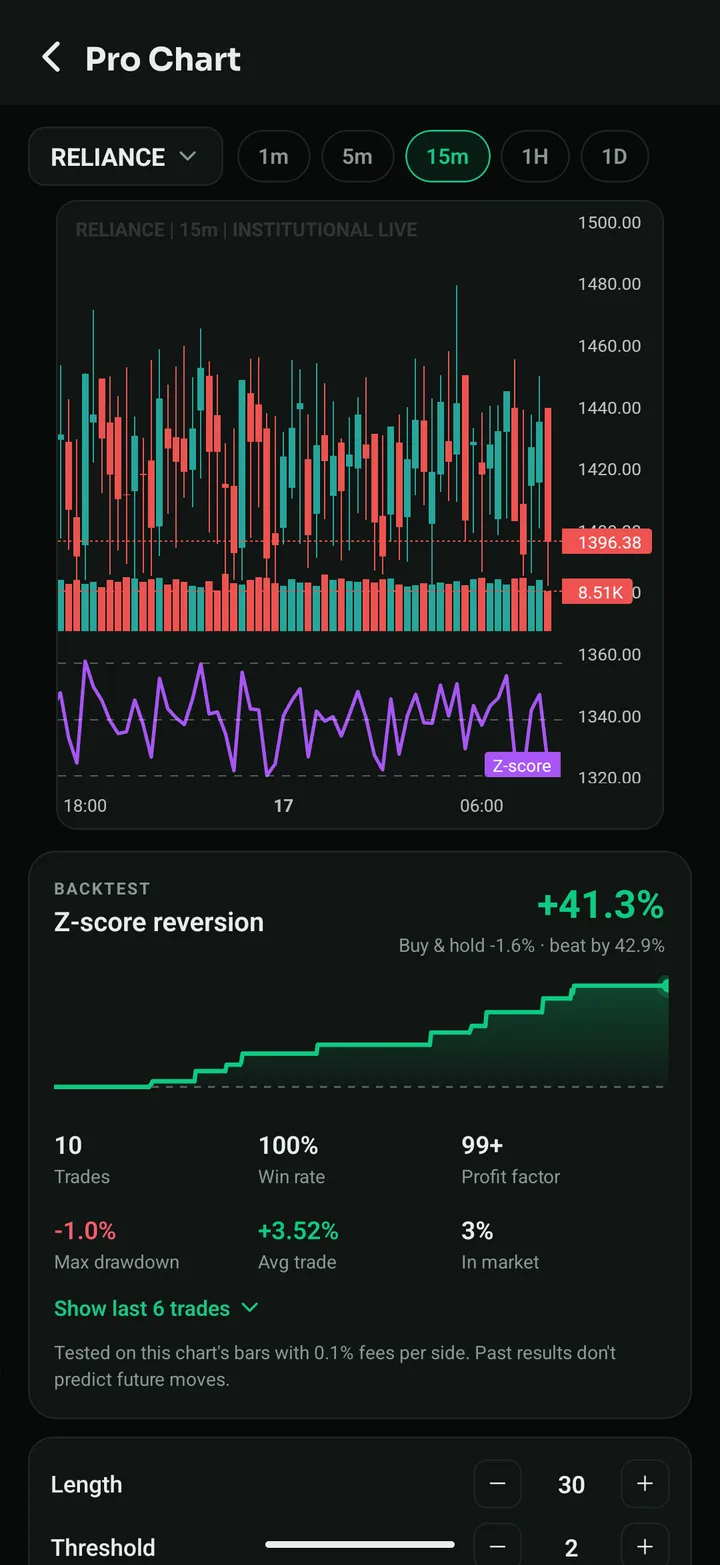
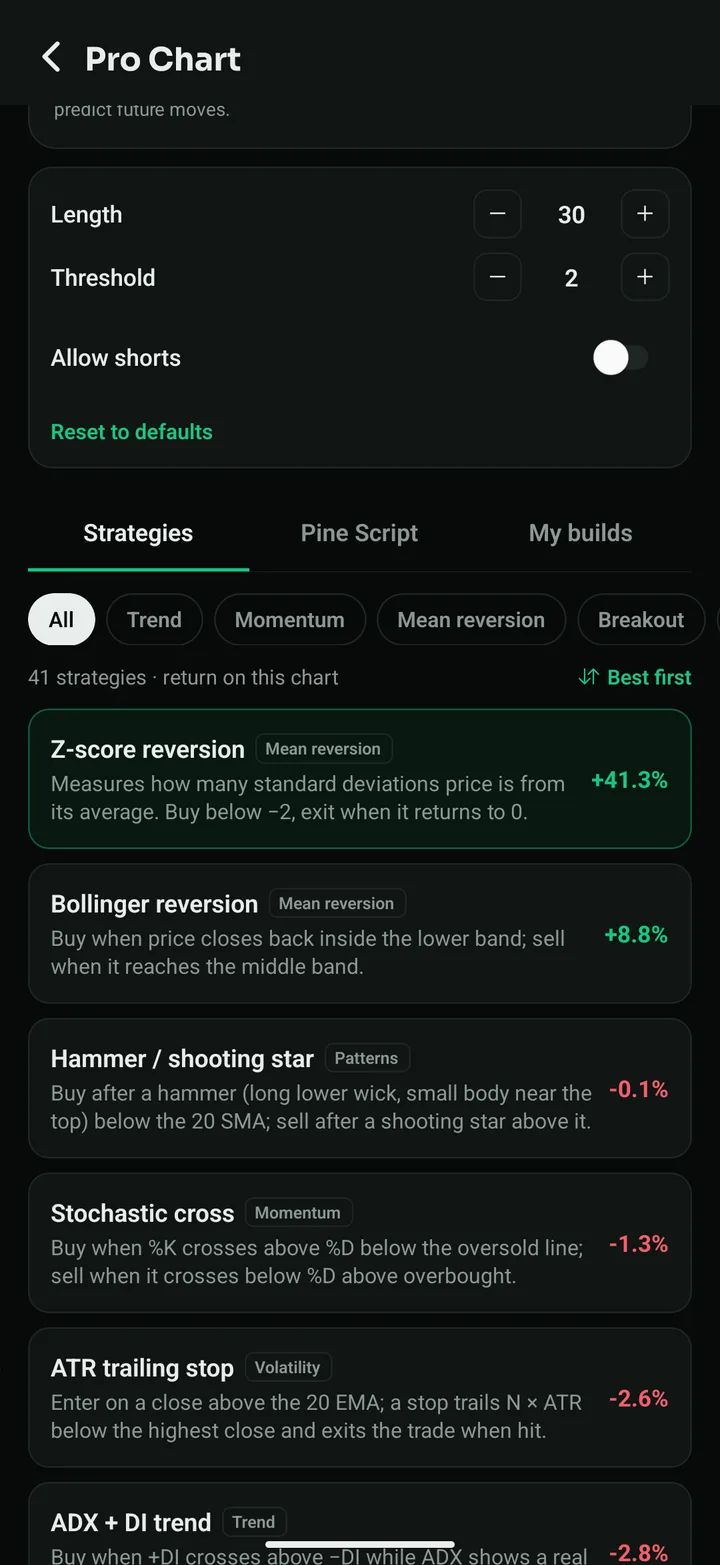
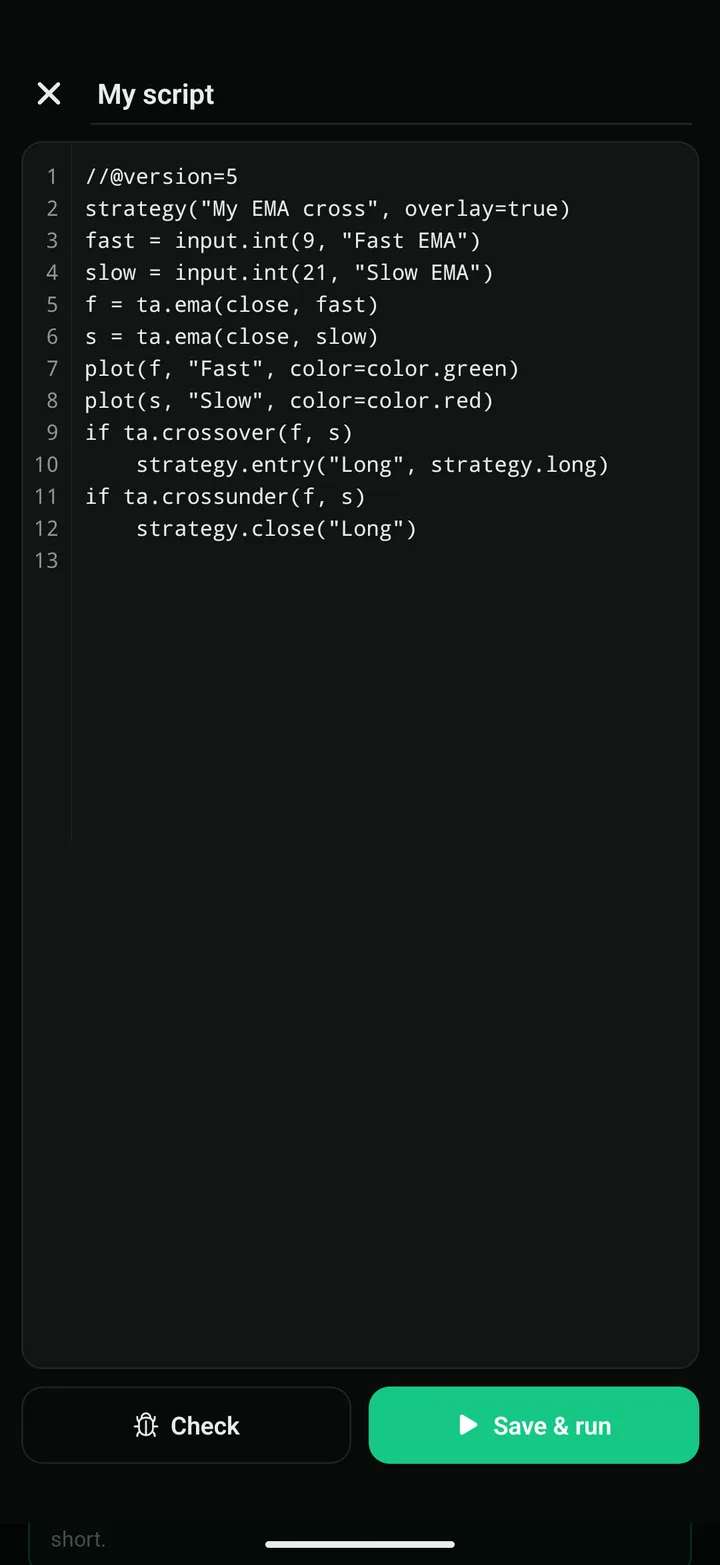
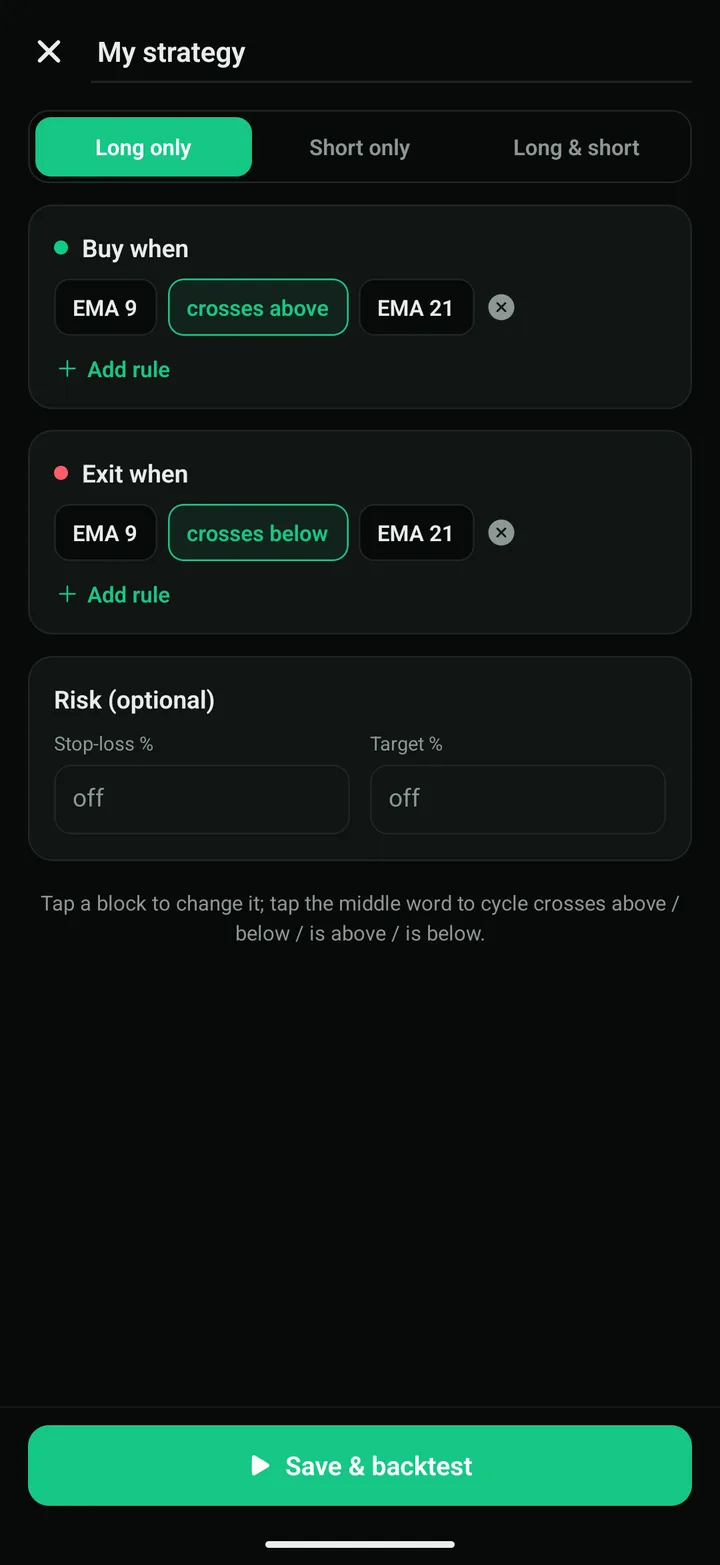
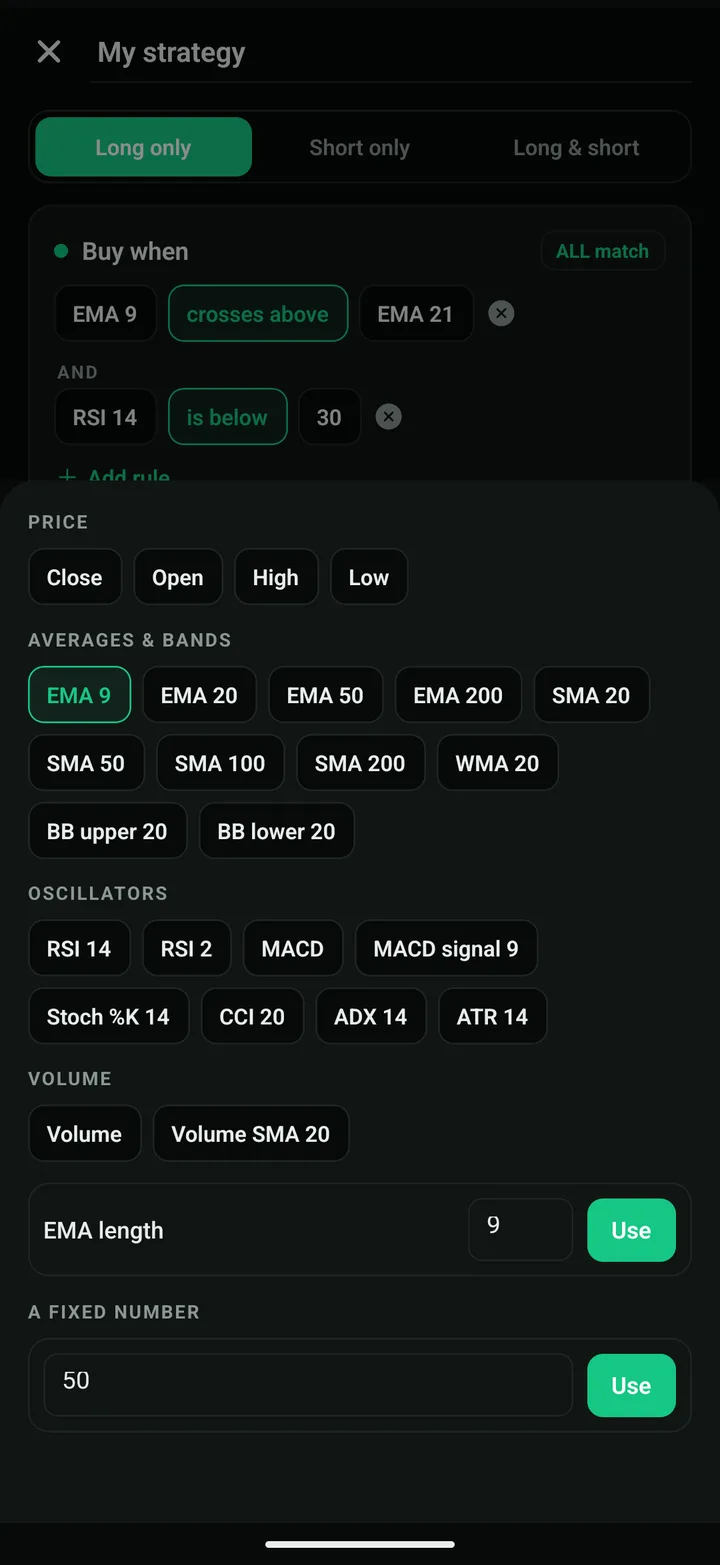
Pick one, build one, or write one.
Trend, momentum, mean reversion, breakout, volatility, volume and candle patterns. Change each setting with steppers, switch shorts on or off, and sort by what did best on this stock.
Rules like “EMA 9 crosses above EMA 21” or “RSI 14 is below 30”, joined by ALL or ANY, for long, short or both, with an optional stop-loss and target.
Write Pine Script v5 with line numbers, tap Check to see errors by line, then Save & run. Start from 15 ready-made scripts.
Signals drawn on the chart, an equity curve, and the numbers that matter, with 0.1% fees per side so results are not flattered.
All 41 prebuilt strategies
Each one is a classic, well-documented rule, explained in plain words in the app.
Trend 11
- SMA crossoverBuy when the fast SMA crosses above the slow SMA; sell when it crosses back below.
- EMA crossoverBuy when the fast EMA crosses above the slow EMA; sell on the cross back below. Reacts faster than SMAs.
- Triple EMA stackIn a trade while EMA fast > mid > slow (a stacked uptrend); out as soon as the stack breaks.
- Golden / death crossThe classic long-term signal: buy on the 50 SMA crossing above the 200 SMA (golden), sell on the death cross.
- SupertrendAn ATR band that trails price. Buy when price closes above it and it flips green; sell when it flips red.
- Parabolic SAR flipFollows the SAR dots: buy when they flip below price, sell when they flip above.
- ADX + DI trendBuy when +DI crosses above −DI while ADX shows a real trend (above the threshold); sell on the opposite cross.
- Ichimoku TK crossBuy when the Tenkan line crosses above the Kijun line with price above the Kijun; sell on the cross back down.
- Heikin-Ashi trendSmoothed candles: buy after two green Heikin-Ashi candles in a row, sell after two red ones.
- Hull MA slopeBuy when the Hull moving average turns up, sell when it turns down. Hull reacts quickly with little lag.
- Aroon crossAroon Up measures how recently the high was set, Aroon Down the low. Buy when Up crosses above Down, sell on the reverse.
Momentum 7
- MACD signal crossBuy when the MACD line crosses above its signal line; sell when it crosses below.
- MACD zero lineBuy when MACD crosses above zero (fast EMA above slow), sell when it drops below zero.
- RSI 50 trendUses RSI as a trend filter: in a trade while RSI is above 50, out when it slips below.
- Stochastic crossBuy when %K crosses above %D below the oversold line; sell when it crosses below %D above overbought.
- Rate of changeMomentum in percent over N bars. Buy when it crosses above zero, sell when it crosses below.
- TRIX signalTRIX is the rate of change of a triple-smoothed EMA. Buy when it crosses above its signal line, sell below.
- Momentum + trend filterBuy when the close makes a new N-bar high while above the 100 EMA; exit on a close below the 20 EMA.
Mean reversion 7
- RSI 30 / 70Buy when RSI climbs back above 30 (leaving oversold); sell when it falls back below 70 (leaving overbought).
- Williams %RBuy when %R rises back above −80 (oversold), sell when it drops back below −20 (overbought).
- CCI ±100Buy when CCI comes back up through −100, sell when it comes back down through +100.
- Bollinger reversionBuy when price closes back inside the lower band; sell when it reaches the middle band.
- Z-score reversionMeasures how many standard deviations price is from its average. Buy below −2, exit when it returns to 0.
- VWAP reversionBuy when price stretches a set percent below VWAP and turns up; exit when it gets back to VWAP.
- RSI(2) pullbackA short-term pullback rule: in an uptrend (above the 200 SMA), buy when 2-period RSI drops under 10; sell when it tops 70.
Breakout 5
- Donchian / TurtleThe Turtle rule: buy on a close above the highest high of the last 20 bars, sell on a close below the lowest low of the last 10.
- Keltner breakoutBuy when price closes above the upper Keltner channel (EMA + ATR); exit when it closes back below the middle EMA.
- Inside bar breakoutAfter an inside bar (range inside the bar before it), buy a close above the mother bar's high; sell a close below its low.
- NR7 breakoutNR7 is the narrowest range of the last 7 bars — a quiet spell. Buy the next close above its high; exit after N bars or below its low.
- Gap and goBuy when a bar opens a set percent above the previous close and closes higher than it opened; exit on the first red bar.
Volatility 4
- Bollinger squeezeWhen the bands get unusually narrow (a squeeze), buy a close above the upper band; exit below the middle band.
- ATR trailing stopEnter on a close above the 20 EMA; a stop trails N × ATR below the highest close and exits the trade when hit.
- Chandelier exitLong stop hangs N × ATR below the highest high; short stop above the lowest low. Buy when price clears the short stop, sell when it breaks the long stop.
- ATR range expansionBuy a green bar whose range is more than N × ATR (a burst of buying); exit when price closes below the bar's midpoint.
Volume 4
- OBV trendOn-balance volume adds volume on up bars and subtracts it on down bars. Buy when OBV crosses above its 20 EMA, sell below.
- Money Flow IndexA volume-weighted RSI. Buy when MFI rises back above 20, sell when it falls back below 80.
- Volume breakoutBuy a close at a new 20-bar high on volume at least N × its 20-bar average; exit on a close below the 10 EMA.
- VWAP trendUses VWAP as the day's fair price: long while price is above VWAP, out (or short) when it closes below.
Patterns 3
- Engulfing candlesBuy after a bullish engulfing candle (a green body that swallows the prior red one); sell after a bearish engulfing.
- Three soldiers / crowsBuy after three green candles, each closing higher (three white soldiers); sell after three falling red ones (three black crows).
- Hammer / shooting starBuy after a hammer (long lower wick, small body near the top) below the 20 SMA; sell after a shooting star above it.
Write a script on your phone and see it on the chart.
A practical subset of Pine Script v5 runs right in the app. This is the library's EMA crossover:
//@version=5
strategy("EMA Crossover", overlay=true)
fastLen = input.int(9, "Fast EMA", minval=2, maxval=100)
slowLen = input.int(21, "Slow EMA", minval=3, maxval=300)
fast = ta.ema(close, fastLen)
slow = ta.ema(close, slowLen)
plot(fast, "Fast EMA", color=color.blue)
plot(slow, "Slow EMA", color=color.orange)
if ta.crossover(fast, slow)
    strategy.entry("Long", strategy.long)
if ta.crossunder(fast, slow)
    strategy.close("Long")
Supported: inputs, var and :=, if/else, for loops, history like close[1], 30+ ta.* functions, plot, hline, plotshape and strategy.entry / close / exit. Read the Pine Script guide.
15 ready-made scripts
- EMA Crossover strategyGoes long when the fast EMA crosses above the slow EMA, and exits on the cross back down.
- RSI Reversal strategyBuys when RSI climbs back above the oversold line and sells when it drops below overbought.
- MACD Signal Cross strategyTrades the MACD line crossing its signal line, long and short.
- Bollinger Mean Reversion strategyBuys a close below the lower band and exits when price returns to the middle band.
- Supertrend Flip strategyFollows the Supertrend: long while it sits under price, short while it sits above.
- Donchian Breakout strategyBuys a new N-bar high and exits on a new shorter-period low — the classic turtle idea.
- Golden Cross strategyThe 50/200 SMA cross that long-term investors watch. Holds until the death cross.
- ATR Trailing Stop strategyEnters above the 20 EMA and protects the trade with a stop that trails price by a multiple of ATR.
- VWAP with Bands indicatorVolume-weighted average price for each day, with a one standard-deviation envelope.
- Stochastic %K %D indicatorWhere the close sits inside the recent high-low range, with a smoothed signal line.
- Momentum (ROC) indicatorRate of change over N bars — positive means price is higher than it was N bars ago.
- Volume Spike Finder indicatorMarks bars whose volume is far above its recent average — often where news or big orders hit.
- CCI Zones indicatorCommodity Channel Index with the ±100 zones that mark unusually strong moves.
- Pivot Highs & Lows indicatorLabels swing highs and lows — bars that are the extreme of the bars on both sides.
- ADX Trend Filter strategyOnly takes DI crossovers when ADX says a trend is actually present.
What each number on the backtest card means
What the strategy made on this chart's bars after 0.1% fees per side, next to simply holding the stock.
The share of closed trades that made money. A low win rate can still be fine if the wins are big.
Money won ÷ money lost. Above 1 means the wins outweighed the losses on this test.
The deepest fall from a high point of the equity curve: how painful the strategy was to hold.
The mean return per trade, after fees. Small numbers here are easily erased by real-world costs.
How much of the period the strategy held a position. Less time in the market means less exposure.
Every strategy here is a white box: its rules are visible and every signal is drawn. Black box vs white box AI trading, explained →
A backtest shows how a rule behaved on past bars of one stock. It does not predict future moves. Use it to learn how strategies behave, never as a buy or sell signal.
Pro Chart lives in the StockYatra app.
Open the side menu and tap Pro Chart. It works on NEPSE, NSE and US stocks, from 1-minute to daily bars.
- 41 strategies with live settings and a shorts switch
- Your own no-code builds and Pine scripts, saved on your phone
- See how you trade yourself in My Analysis: score, equity curve and habits
Pro Chart FAQ
Is Pro Chart free?
Yes. All 41 strategies, the no-code builder, the Pine Script editor and every backtest are free in the StockYatra app. You practise with virtual coins; nothing costs real money.
Where do I find it?
Open the StockYatra app, open the side menu and tap Pro Chart. Pick a stock and a time frame, then a strategy, a build of your own or a Pine script.
Which prices are the backtests run on?
On the bars of the chart you are looking at: StockYatra's practice-market prices, a simulation that moves around each stock's real-world level. They are for learning and are not official exchange quotes.
Does a good backtest mean the strategy will make money?
No. A backtest shows how a rule would have behaved on past bars of one stock. Markets change, real trading has costs and slippage, and a rule tuned to the past often fails later. Use it to understand ideas, not as a signal.
How much Pine Script does it support?
A practical subset of Pine Script v5: inputs, variables with var and :=, if/else, for loops, history like close[1], 30+ ta.* functions (sma, ema, rsi, macd, bb, atr, supertrend, stoch, vwap, crossover and more), plot, hline, plotshape and strategy.entry / close / exit. Errors are shown by line number.
Is this investment advice?
No. StockYatra is an education app, not a broker or adviser. Strategies and scripts are teaching tools; nothing on this page is a recommendation to buy or sell any security.
More: the strategy guide · build your own · My Analysis · black box AI, explained · algo trading · learn algo trading · changelog