In short
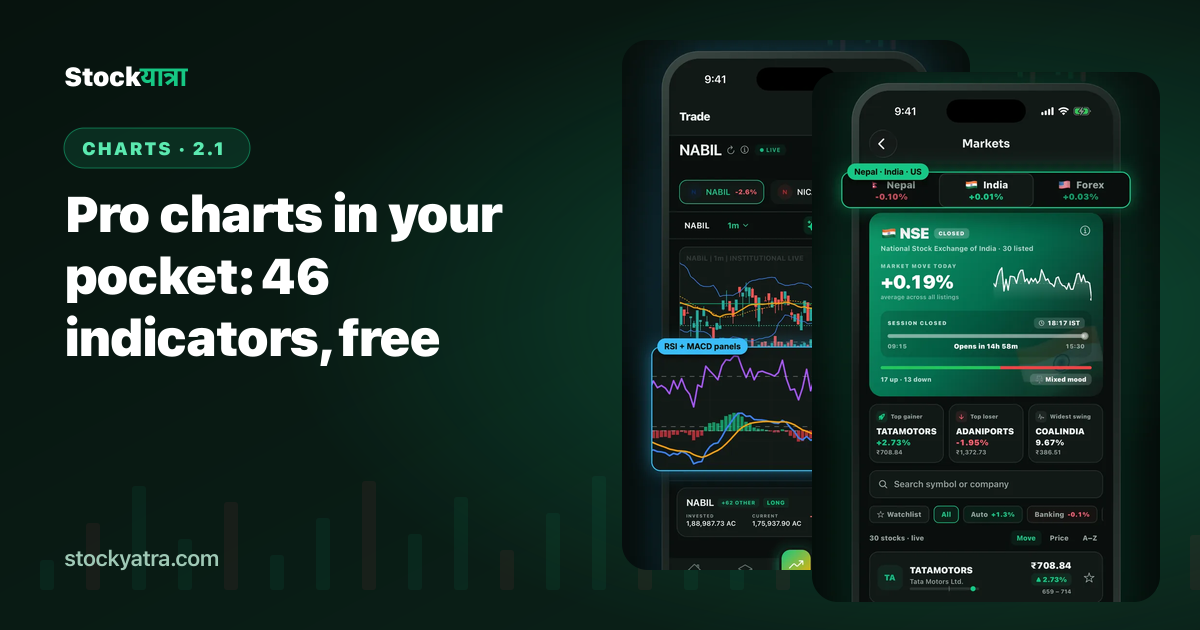
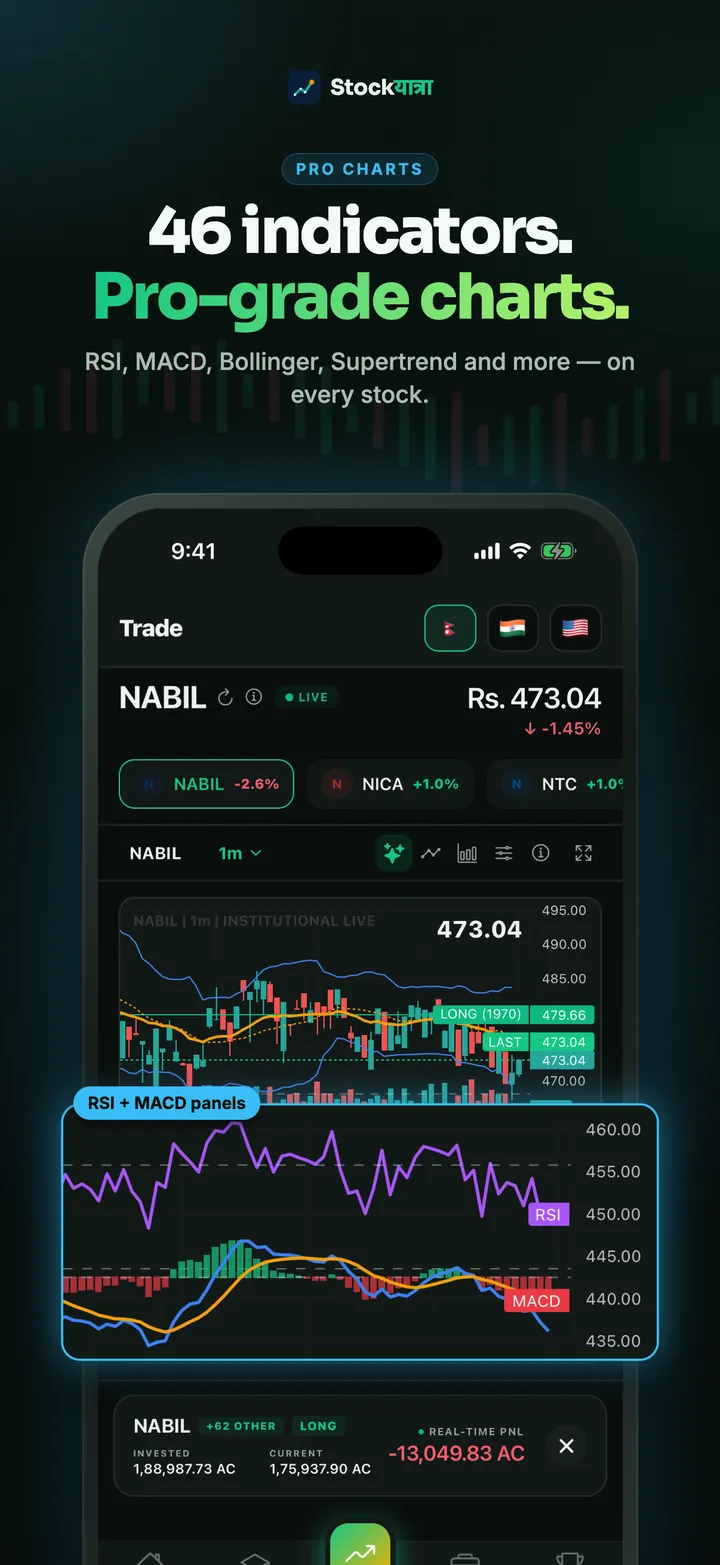
- 46 working indicators: overlays on price plus stacked panes for oscillators.
- New chart types: hollow candles, Renko, line break, baseline and OHLC bars.
- Ask Lumi to read any chart in plain words.
- Practise on simulated prices, so a wrong read costs coins, not savings.
A chart is the first thing every trader looks at and the last thing most beginners understand. StockYatra 2.1 gives you a professional chart on your phone, with the same idea we teach in every lesson: start with a few tools you understand, then add more.
Start with these four
- Moving averages (SMA/EMA) show the direction. SMA vs EMA explained.
- RSI shows how stretched a move is. RSI and MACD for beginners.
- MACD shows momentum turning.
- Volume shows how much conviction is behind a move.
Each oscillator opens in its own pane under the price, so the candles stay readable.
New ways to draw price
Hollow candles show whether a candle closed above its open and above the previous close. Renko and line break ignore time and only draw when price moves enough, which removes noise. Baseline colours price above and below a reference. Compare the chart types.
Let Lumi read it with you
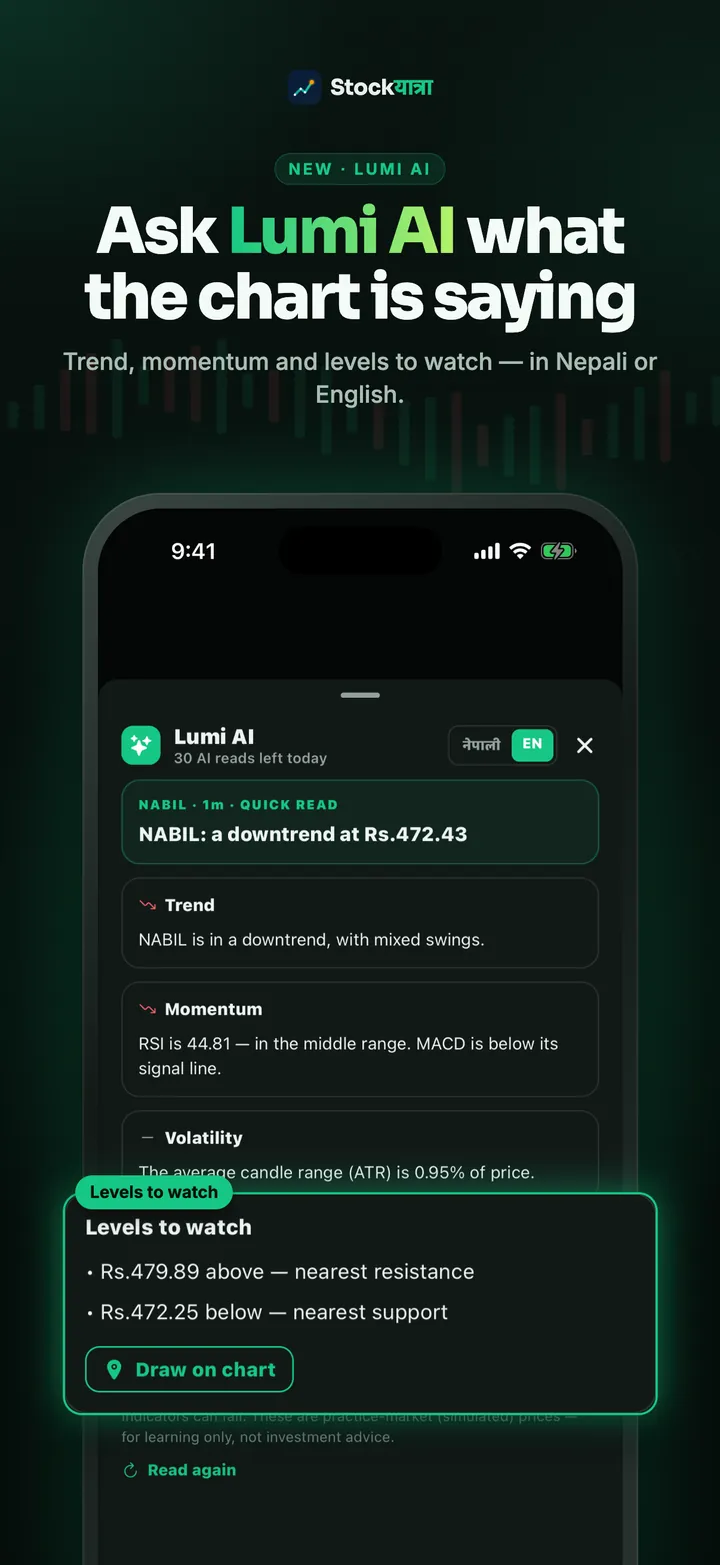
Not sure what you are looking at? Ask Lumi. It summarises trend, momentum and volatility and marks the nearest support and resistance on the chart. Then compare its read with yours.
Want more on a bigger screen?
The free web charts add bar replay, multi-chart layouts and drawing tools, with no sign-up. The same pro chart lives in the web trade terminal with your StockYatra account.
Key takeaways
- Learn four indicators well before adding more.
- Use Renko or line break to cut noise.
- Ask Lumi to check your read.
- Practise on simulated prices first.
Summary in Nepali (नेपालीमा सारांश)
StockYatra 2.1 मा ४६ इन्डिकेटर र Renko, line break जस्ता नयाँ चार्ट प्रकार छन्। सुरुमा moving average, RSI, MACD र volume राम्ररी सिक्नुहोस्, अनि Lumi लाई चार्ट पढ्न लगाएर आफ्नो बुझाइ जाँच्नुहोस्।
Open a pro chart in StockYatra
StockYatra 2.1 is free on the App Store and Google Play. One link opens the right store for your phone. You start with 10,000 free virtual coins and earn more by learning; prices are simulated and coins are never real money.
More from the 2.1 launch
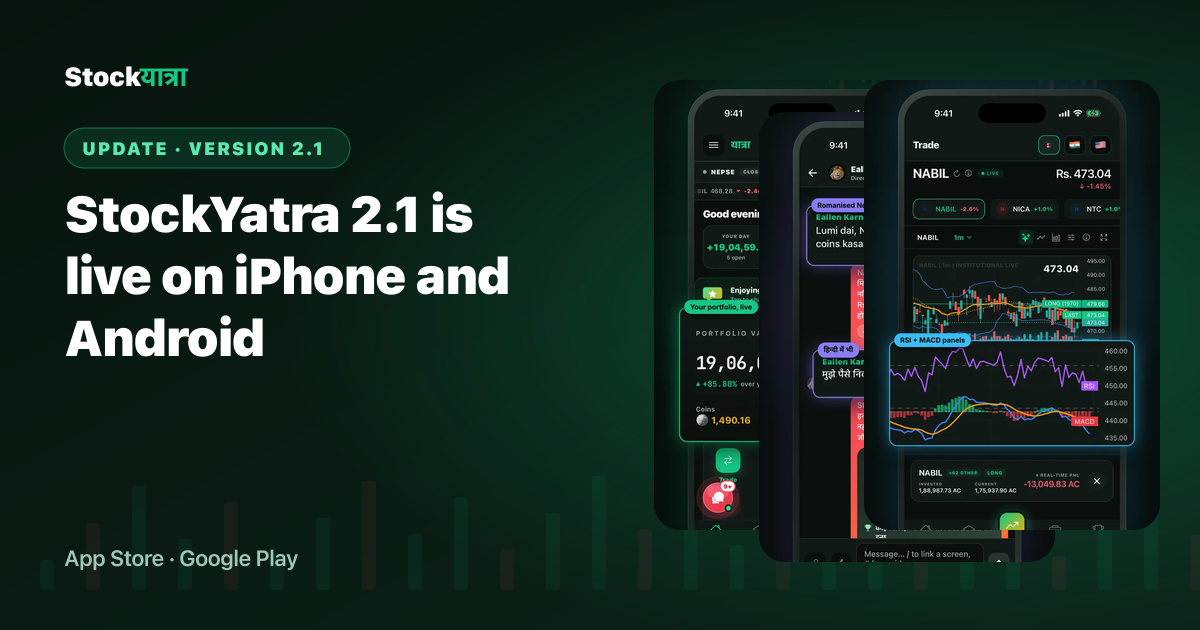
- StockYatra 2.1 is live on iPhone and Android
- Meet Lumi: ask about charts in Nepali, Hindi or English
- Case study: 30 to 2,150 learners in 60 days
- Case study: 357 certificates and how beginners learn
- Full changelog
StockYatra is an education app, not a broker or adviser. Prices on its practice market are simulated around each stock's real-world level, coins are virtual, and nothing here is a recommendation to buy or sell any security.