Pro Chart: Backtest 41 Trading Strategies on Any Stock, Free
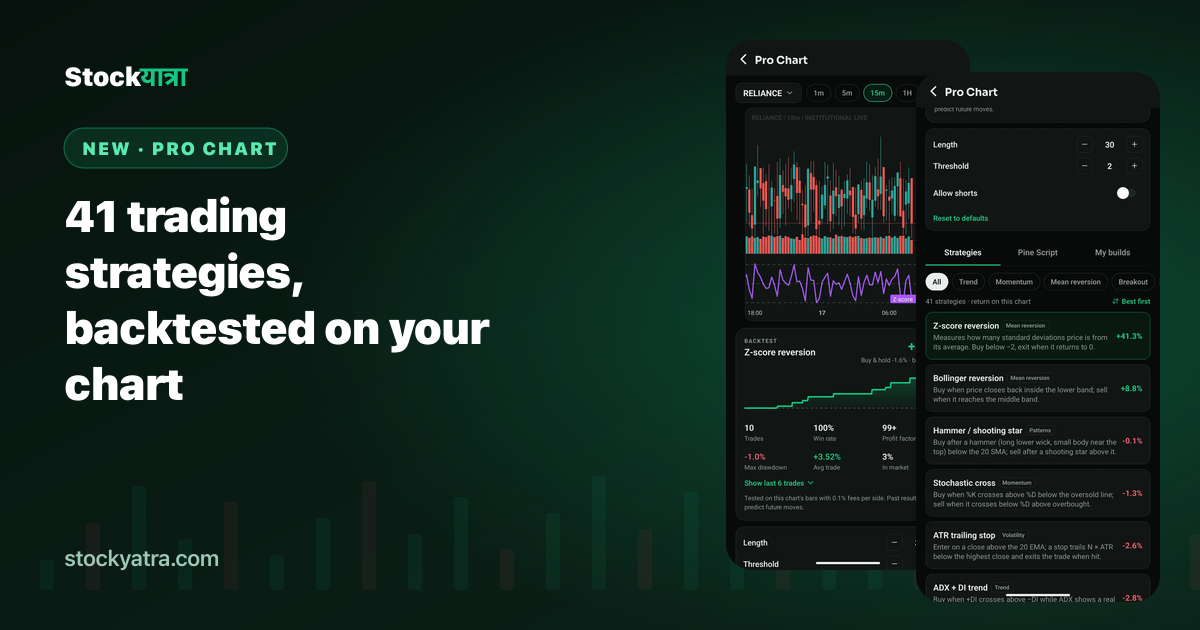
StockYatra Pro Chart runs 41 classic trading strategies on NEPSE, NSE and US stocks and shows a full backtest with fees: return vs buy and hold, win rate, profit factor and drawdown.
Learn to trade, step by step
Nepal, India and US boards, live
Calculators and charts for every trade
Learn alongside other traders
One account on phone and web
Everything we've written about charts. Read, then practise it free on StockYatra.

StockYatra Pro Chart runs 41 classic trading strategies on NEPSE, NSE and US stocks and shows a full backtest with fees: return vs buy and hold, win rate, profit factor and drawdown.

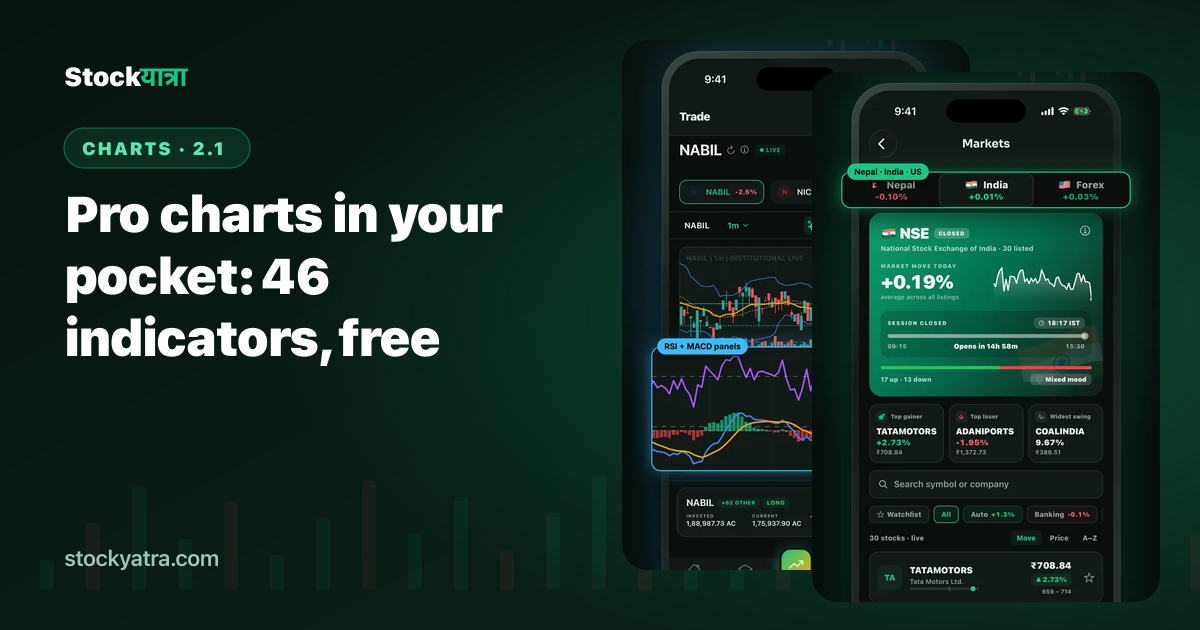
StockYatra 2.1 brings pro charts to your phone: 46 indicators, RSI and MACD panes, hollow candles, Renko, line break and OHLC bars, plus a full-screen order ticket.

Lumi is StockYatra's AI market buddy. Ask in Nepali, Hindi or English and get short, clear answers about charts, indicators, IPOs and the app. Education only, never tips.

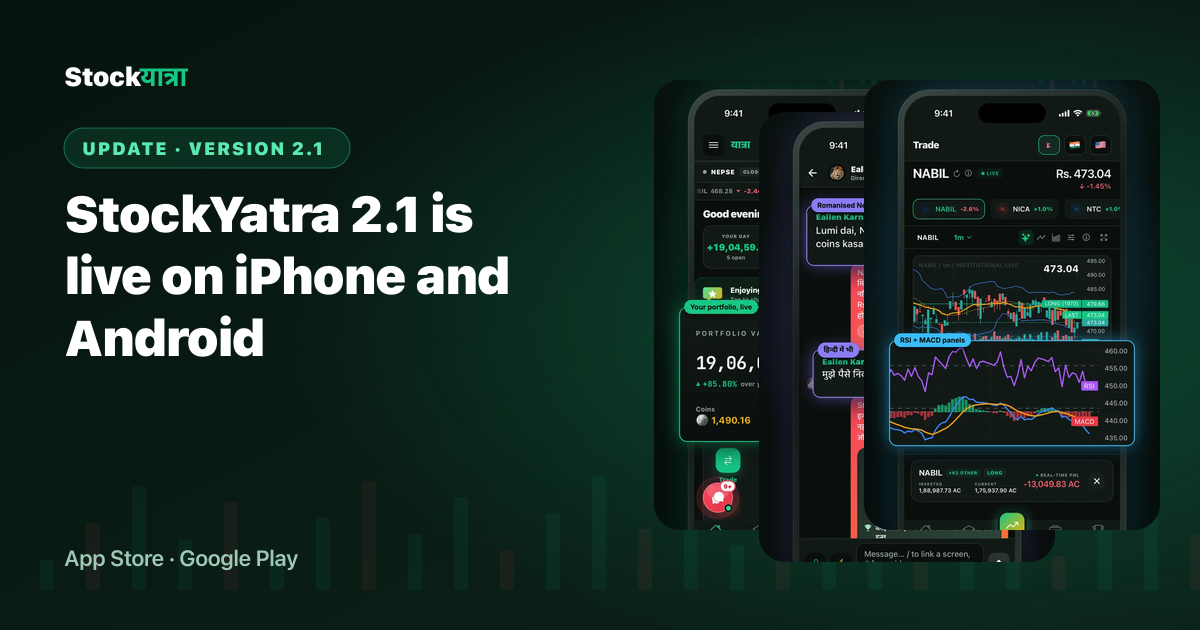
StockYatra 2.1 is now on the App Store and Google Play: Lumi AI in Nepali, Hindi and English, pro charts with 46 indicators, chat with friends, leagues and the monthly Cup.

A step-by-step routine to practise reading charts without risking money: use bar replay on the free StockYatra charts to hide the future, make a call, check it, keep score, then paper trade in the app.

Candlestick, hollow candle, OHLC bar, line, Heikin Ashi, Renko and line break charts compared: how each is built, what it is good at, what it hides, and when a beginner should use it.

What a moving average is, how a simple (SMA) and exponential (EMA) moving average differ, how to pick a length, what golden and death crosses are, and why crossovers fail in sideways markets.

A plain-language guide to RSI and MACD: how each is calculated in principle, how to read overbought, oversold, crossovers and divergence, and the market conditions where both give bad signals.

What support and resistance are, why they work, how to draw them as zones, what happens when they break, and the mistakes beginners make. Worked examples with simple round numbers.

Learn to read candlestick charts step by step: open, high, low and close, bodies and wicks, timeframes, candles in groups, volume, and the mistakes beginners make. With free charts to practise on.