In short
- Quant trading uses data, statistics and code to find and test trading rules.
- Quants follow a loop: idea, data, backtest, risk, live monitoring.
- Common factors include value, momentum, quality, size and low volatility.
- The main danger is overfitting: a strategy that fits the past but not the future.
"Quant" is short for quantitative. A quant trader asks: can I describe this idea precisely, test it on data, and size the risk before putting money on it? Big quant funds employ scientists and run on huge computing budgets, but the core way of thinking is useful to anyone.
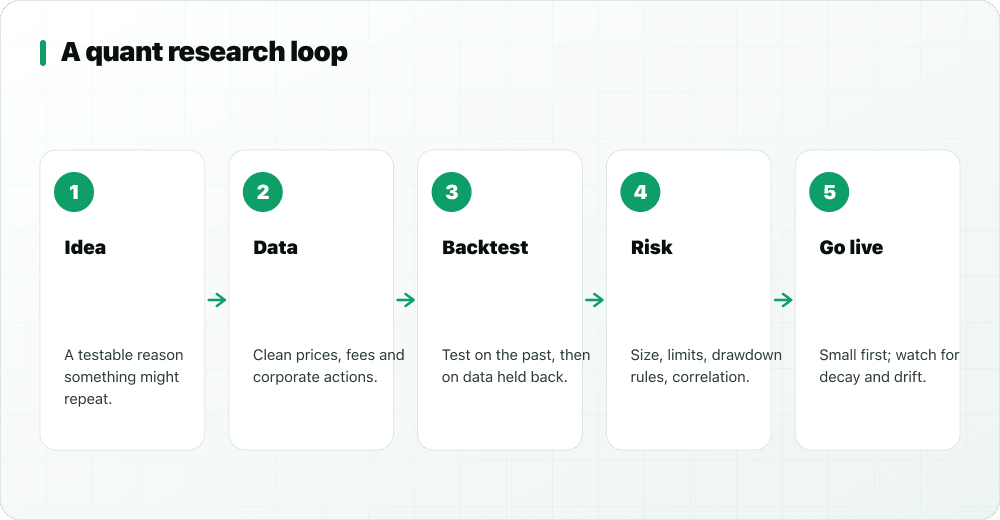
The quant research loop
- Idea: a reason something might repeat, for example "stocks that rose most over the last months tend to keep rising for a while".
- Data: clean price history, adjusted for splits and dividends, with realistic fees.
- Backtest: apply the rule to the past. Keep some data aside to test on later (out-of-sample).
- Risk: position sizing, limits, maximum drawdown, and how the strategy behaves with your others.
- Live and monitor: start small and watch whether real results match the test. Edges often fade as others find them.
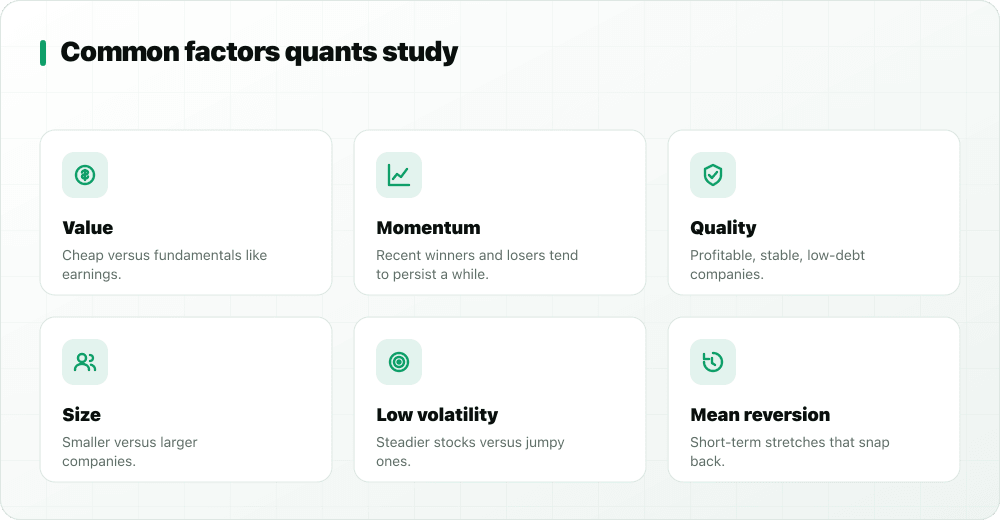
Factors, in plain words
Much quant investing is built on factors: traits that academic and industry research has linked to returns over long periods. Momentum (recent winners), value (cheap versus fundamentals), quality (profitable, stable companies), size and low volatility are the best known. Short-term traders also study mean reversion (stretches that snap back). Factors go through long periods of not working, which is why quants diversify across many of them.
Why most quant ideas fail
- Overfitting: tune enough knobs and any strategy looks brilliant on past data.
- Look-ahead bias: using information you would not have had at the time, such as trading on today's close at today's close.
- Survivorship bias: testing only stocks that still exist today.
- Ignoring costs: fees, spreads and slippage turn many small edges into losses.
- Regime change: what worked in a calm market may fail in a crisis.
How famous quant firms are described
Firms such as Renaissance Technologies, Two Sigma and D. E. Shaw are often described as quant leaders. Publicly, little is known about their exact methods, and reported results of one fund cannot be copied by reading about them. Treat any claim to "trade like a top quant fund" as marketing.
How to start learning quant thinking
- Write one rule in precise words.
- Test it, and read every trade, not just the total. Our first Python backtest shows how, step by step.
- Change one thing at a time and keep notes.
- Test on a market or period you did not use to design it.
In StockYatra's Pro Chart you can test 41 rule-based strategies on NEPSE, NSE and US practice charts and compare results, or write your own rules or Pine Script. Every signal is shown, so you can see why a strategy made or lost money.
Key takeaways
- Quant trading turns ideas into precise rules tested on data.
- Factors like momentum and value are long-run tendencies, not promises.
- Overfitting, look-ahead bias and costs sink most ideas.
- Start with one simple, well-tested rule and honest notes.
Learn the skill, not the speed
StockYatra is a free practice app for Nepal (NEPSE), India (NSE) and US stocks. Write rules, test 41 transparent strategies or your own Pine Script in Pro Chart, backtest them on the chart, and practise with virtual coins. Nothing is real money.
More on algos, HFT and quant
- What is high-frequency trading?
- HFT vs algo vs manual trading
- Market making and the bid-ask spread
- What caused the 2010 Flash Crash?
- The NSE co-location case, explained
- Jane Street vs SEBI: the case explained
- How trading bots and automation work
- Python for trading: your first backtest
- Algo trading: the one-page guide
- HFT: the one-page guide
- Black box AI trading, explained
StockYatra is an education app, not a broker, adviser or research analyst. Nothing here is a recommendation to buy or sell any security or to use any trading product. Case summaries are based on public orders and press reports; allegations are not findings, and outcomes can change on appeal. Practice prices are simulated and coins are virtual.