In short
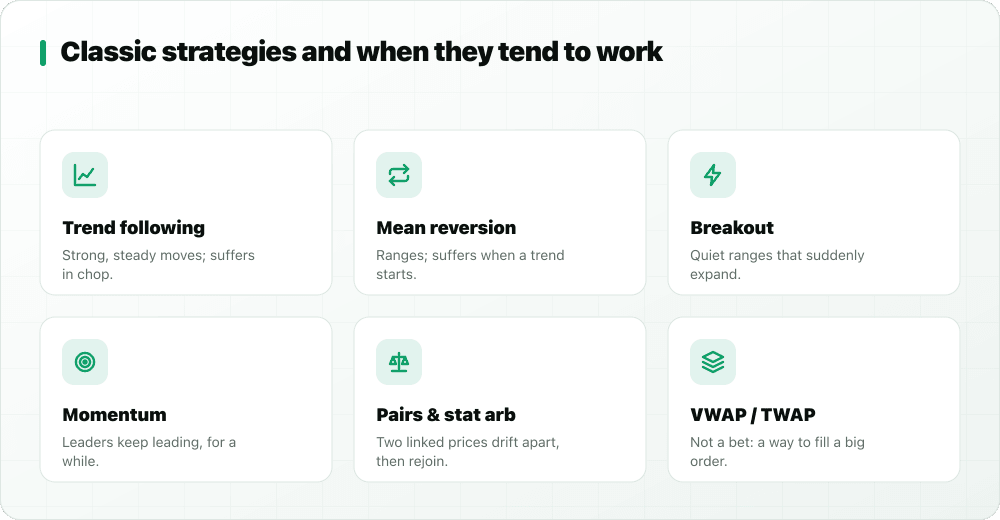
- Most algos are built on a few ideas: trend following, mean reversion, breakout, momentum, pairs/stat arb, execution and market making.
- Every strategy has a market it likes and one that hurts it. None works all the time.
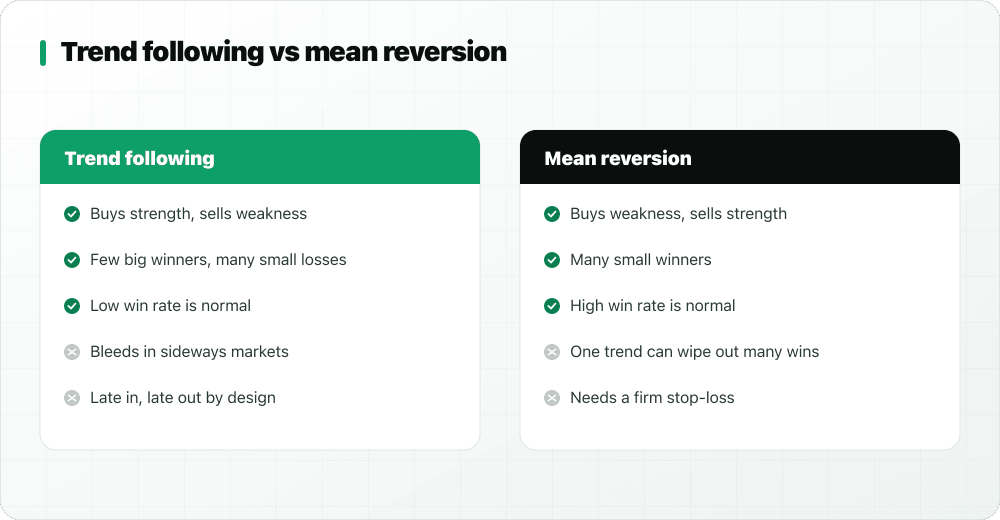
- Trend systems usually win less often but bigger; mean reversion wins often but small.
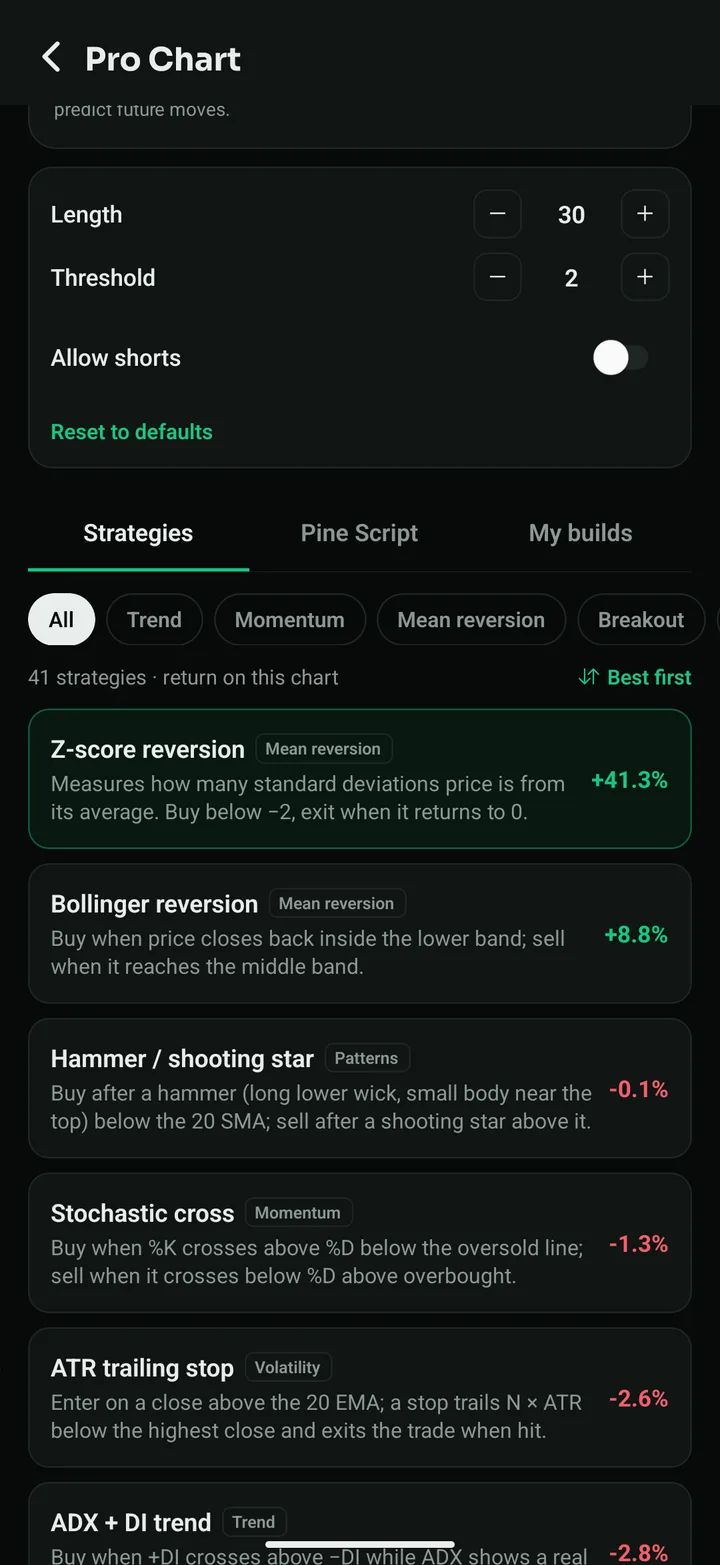
- You can test the first four on StockYatra's Pro Chart; the last three need data and access only institutions have.
Strip away the names and indicators, and most trading algorithms rest on a handful of ideas about how prices behave. Knowing these ideas helps you understand any strategy you meet, including the ones sold as "secret AI". Below, each idea is explained with the market it suits, how it fails, and how to try it yourself.
1. Trend following
Idea: prices that are moving tend to keep moving for a while. Buy strength, sell weakness, and stay in until the trend ends.
Typical rules: a faster moving average crosses a slower one; price closes above a Supertrend line; ADX shows a strong trend with +DI above −DI.
Likes: long, steady moves. Hurt by: sideways chop, where it buys tops and sells bottoms over and over.
Try it in Pro Chart: SMA crossover, EMA crossover, Triple EMA stack, Golden / death cross, Supertrend, Parabolic SAR flip, ADX + DI trend, Ichimoku TK cross, Heikin-Ashi trend, Hull MA slope, Aroon cross. Pine library: EMA Crossover, Supertrend Flip, Golden Cross, ADX Trend Filter.
2. Mean reversion
Idea: when price stretches far from its usual level, it tends to come back toward it.
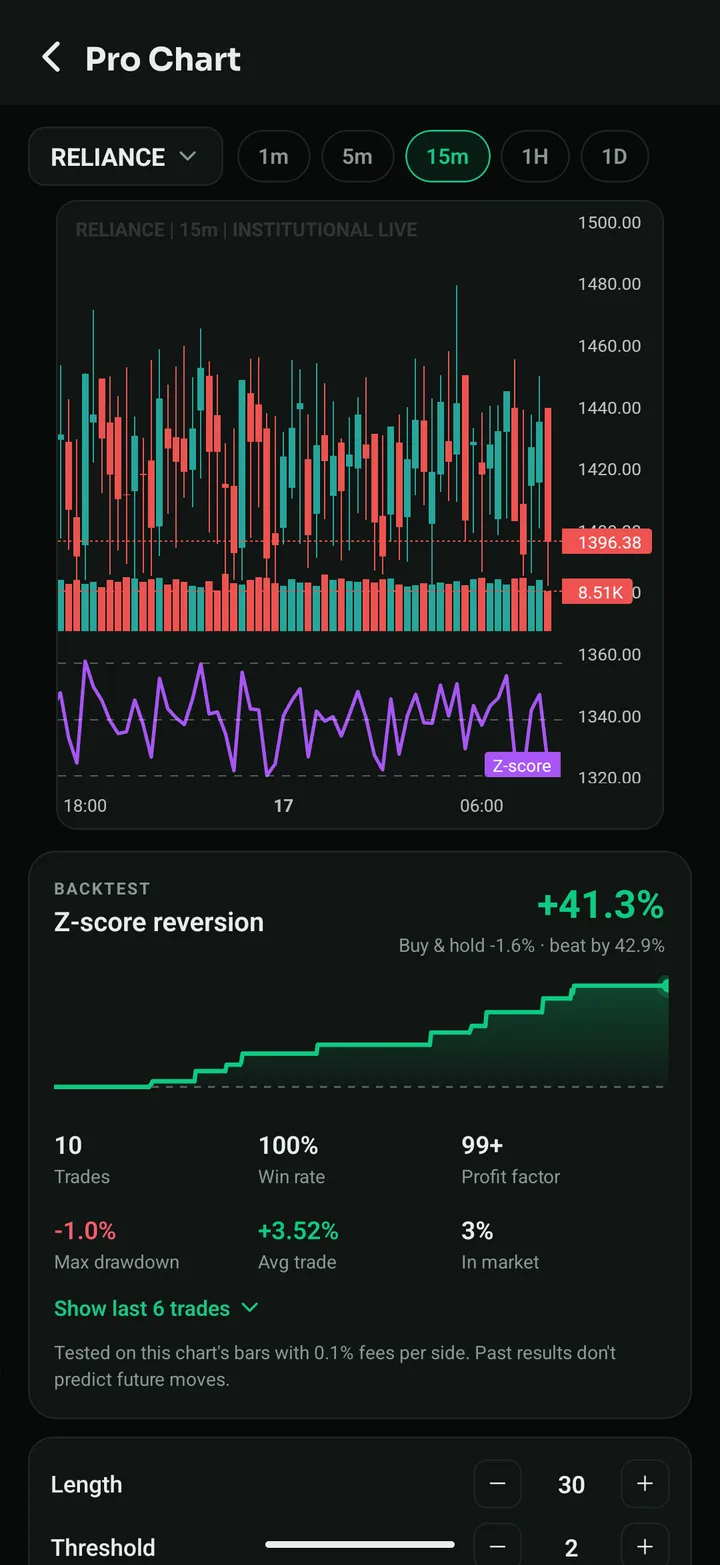
Typical rules: buy when RSI climbs back above 30; buy when price closes back inside the lower Bollinger Band; buy when the z-score (distance from the average in standard deviations) is below −2 and exit near 0.
Likes: range-bound markets. Hurt by: a new strong trend, where "cheap" keeps getting cheaper. A firm stop-loss matters.
Try it: RSI 30 / 70, Williams %R, CCI ±100, Bollinger reversion, Z-score reversion, VWAP reversion, RSI(2) pullback. Pine library: RSI Reversal, Bollinger Mean Reversion.
3. Breakout
Idea: after a quiet period, a move out of the range can start a bigger move.
Typical rules: buy a close above the highest high of the last 20 bars (the "Turtle" rule); buy when price leaves a Keltner Channel; buy the break of an inside bar or the narrowest range in seven bars.
Likes: quiet ranges that suddenly expand. Hurt by: false breakouts that reverse straight back into the range.
Try it: Donchian / Turtle, Keltner breakout, Inside bar breakout, NR7 breakout, Gap and go, Bollinger squeeze, ATR range expansion, Volume breakout. Pine library: Donchian Breakout.
4. Momentum
Idea: what has risen fastest recently tends to keep outperforming for a while. Close to trend following, but measured by speed of change rather than direction alone.
Typical rules: MACD crosses its signal line; rate of change turns positive; RSI holds above 50.
Try it: MACD signal cross, MACD zero line, RSI 50 trend, Stochastic cross, Rate of change, TRIX signal, Momentum + trend filter. Pine library: MACD Signal Cross, Momentum (ROC), Stochastic %K %D.
5. Pairs trading and statistical arbitrage
Idea: two related stocks (two banks, say) usually move together. When the gap between them widens unusually, buy the cheap one, sell the expensive one, and wait for the gap to close. Statistical arbitrage applies the same idea across many stocks at once.
Hurt by: relationships that break for good, for example after a merger or a scandal.
In StockYatra: Pro Chart works on one stock at a time, so true pairs trading is not built in. The Z-score reversion strategy teaches the core maths on a single price.
6. Execution algorithms: VWAP and TWAP
These are not bets on direction. An institution that must buy a million shares splits the order into small pieces: TWAP spreads them evenly over time, VWAP follows the market's own trading volume during the day. The goal is a fair average price with little market impact.
In StockYatra: VWAP trend and VWAP reversion use VWAP as a reference line, and the Pine library has VWAP with Bands, so you can learn to read VWAP. Order-splitting execution itself is not simulated.
7. Market making and high-frequency trading
Market makers quote a price to buy and a slightly higher price to sell at the same time, earning the small difference (the spread) many times over, while managing the risk of being caught on one side. Doing this competitively requires very fast systems placed next to the exchange's computers. It is not something a retail trader can practise realistically, but understanding it explains why spreads exist.
Exits and risk: the part that matters most
Every strategy above needs an exit for when it is wrong. Common choices are a fixed stop-loss, a trailing stop that follows price, or an ATR-based stop that adapts to volatility. In Pro Chart, ATR trailing stop and Chandelier exit show how volatility-based exits behave, and the no-code builder lets you add a stop-loss % and target % to any rule.
How to compare them fairly
- Test each on the same stocks and timeframes, with costs.
- Look at trades, drawdown and profit factor, not just return.
- Check both trending and sideways periods.
- Keep data aside for an out-of-sample check. See how to backtest.
Key takeaways
- Trend, mean reversion, breakout and momentum are where most retail algos start.
- Each family has a market it likes and one that hurts it.
- Pairs/stat arb, execution and market making need institutional data and access.
- Exits and risk control matter as much as entries.
- Compare strategies on the same data, with costs and out-of-sample checks.
Test 41 classic strategies on real charts
StockYatra is a free practice app for Nepal (NEPSE), India (NSE) and US stocks. Test 41 transparent strategies, write rules without code or in Pine Script, and backtest them on the chart with virtual coins. Nothing connects to a broker and nothing is real money.
The algo trading series
- What is algorithmic trading?
- Algo trading in India: the 2026 rules
- Is algo trading allowed in Nepal?
- How to backtest a trading strategy
- Algo trading vs manual trading
- How to start algo trading as a beginner
- Algo trading: the one-page guide
- Black box AI trading, explained
- Pro Chart: 41 strategies with every rule shown
StockYatra is an education app, not a broker, adviser or research analyst. Nothing here is a recommendation to buy or sell any security, to use any trading product, or legal advice. Rules and dates are summarised for learning; check the regulator's and your broker's current notices before acting. Practice prices are simulated and coins are virtual.