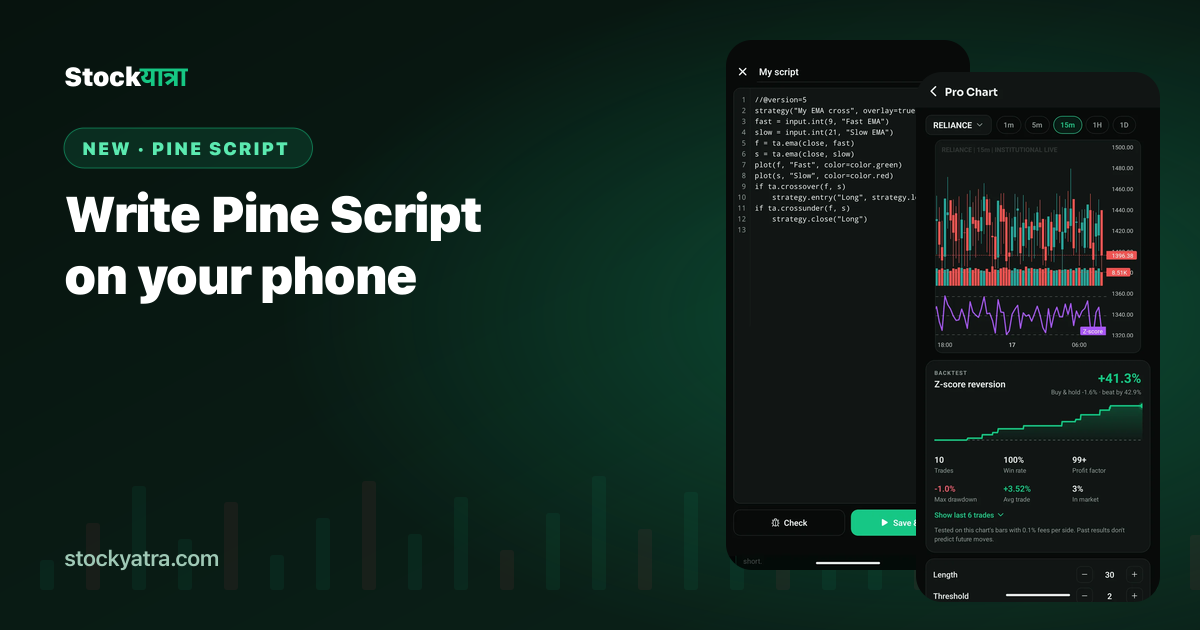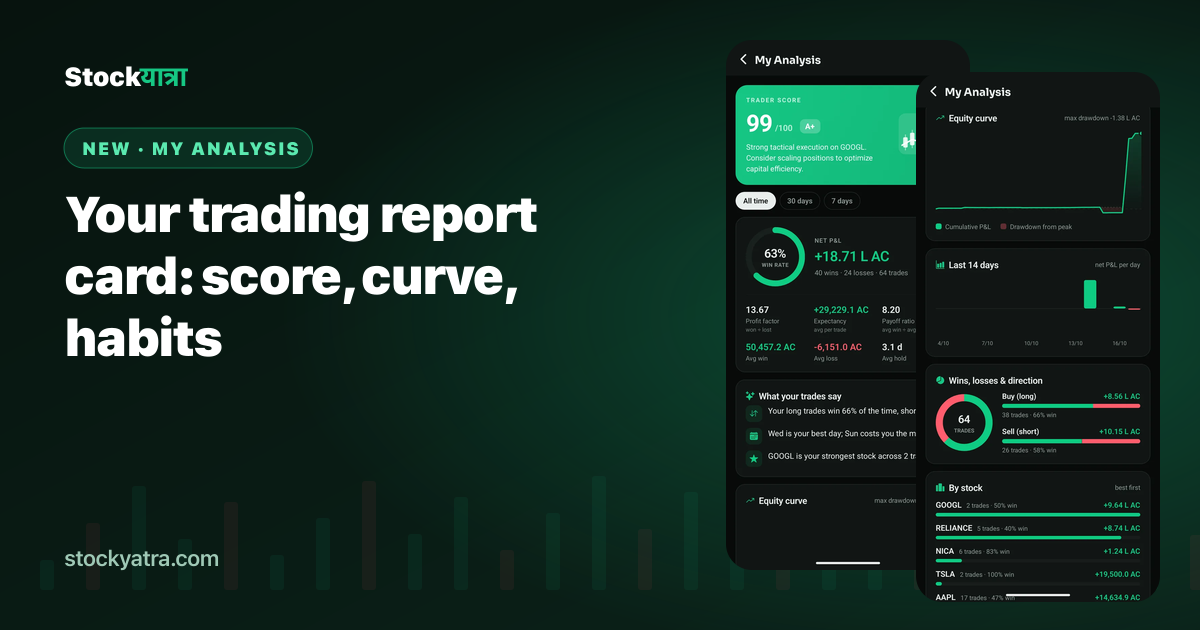
In short
- Open My Analysis from the side menu under Your Trading.
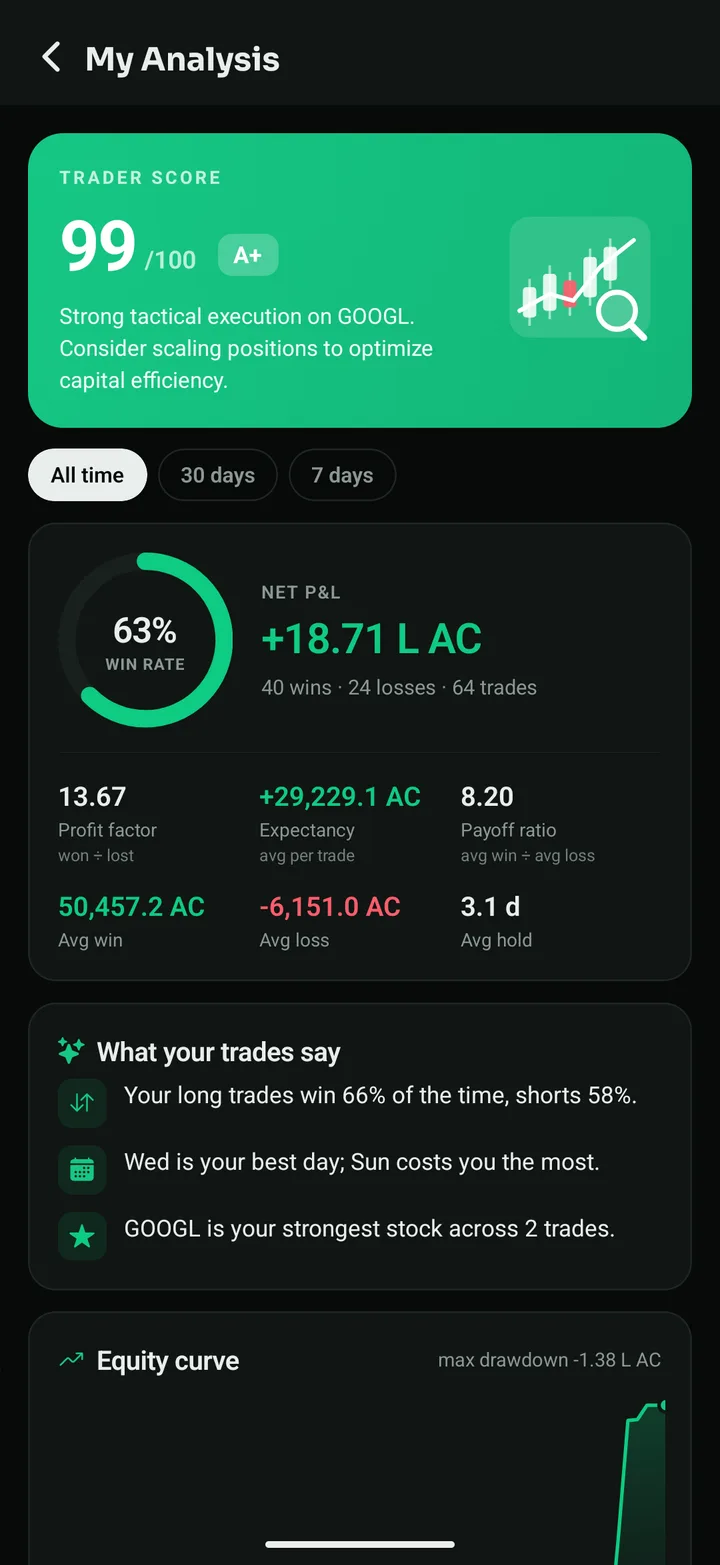
- A trader score out of 100 with a grade, built from win rate, profit factor, drawdown and how many trades you have closed.
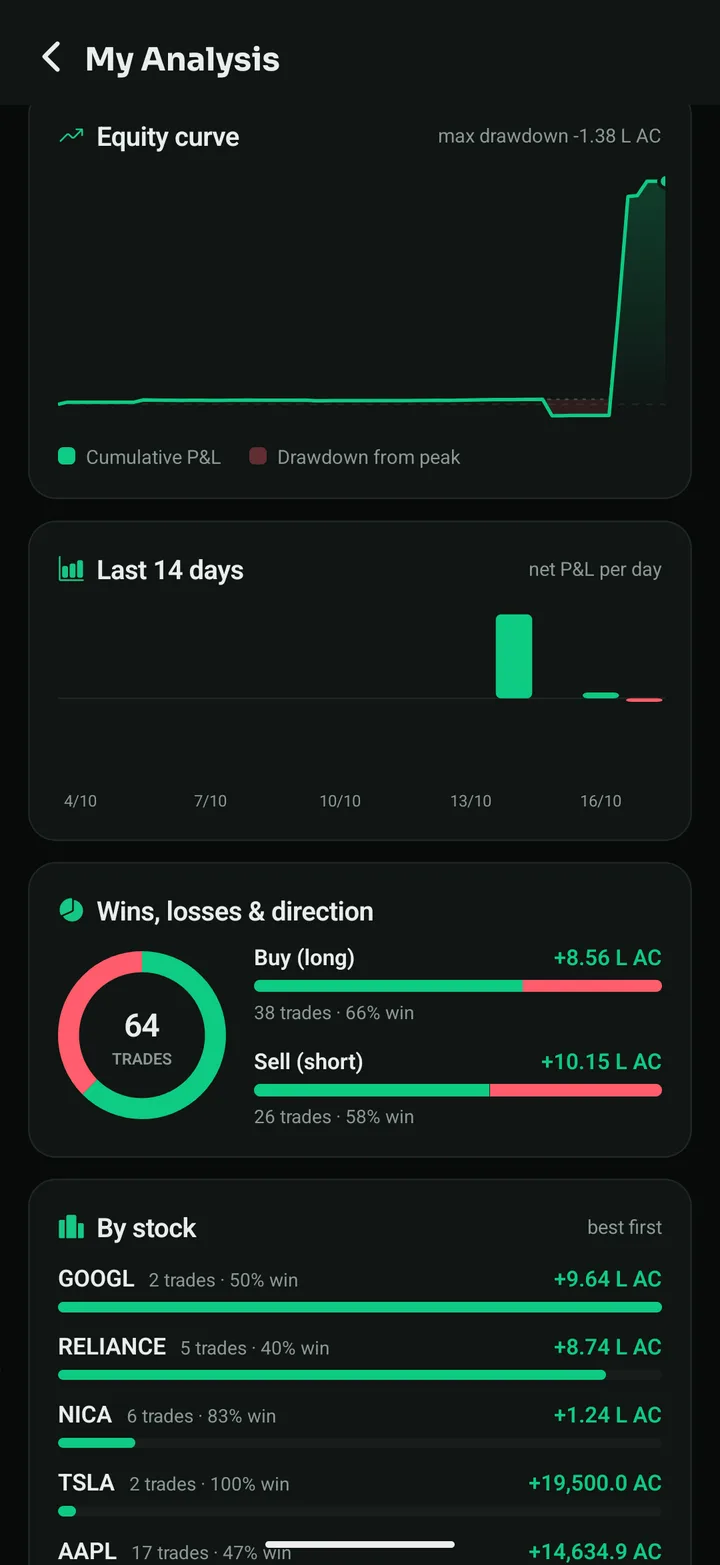
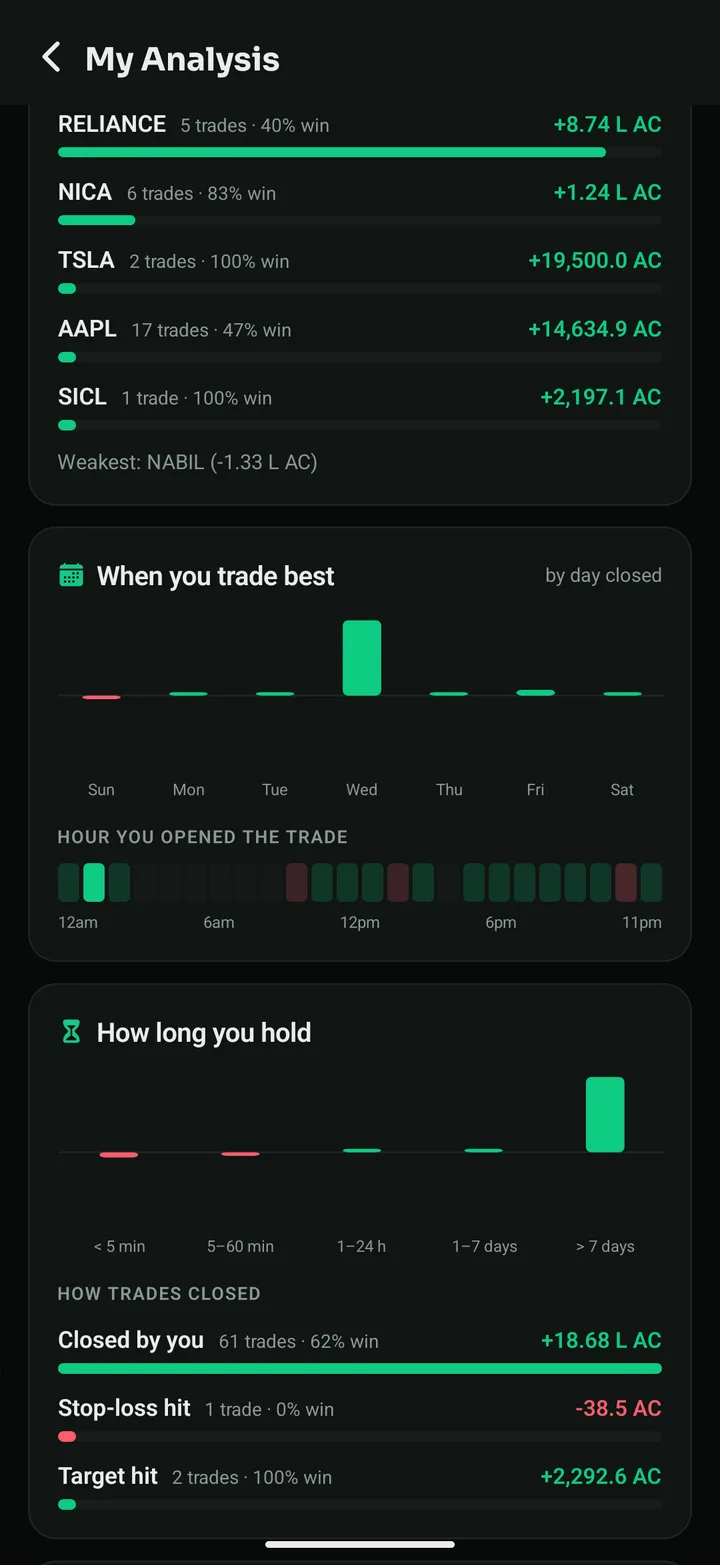
- Charts: equity curve with drawdown, last 14 days, wins and losses by direction, results by stock, weekday, hour, holding time and how trades closed.
- Plain-language insights about your habits, and filters for all time, 30 days and 7 days.
The numbers, explained
| Number | Meaning |
|---|---|
| Win rate | Share of closed trades that made money |
| Profit factor | Total won ÷ total lost. Above 1 means you made more than you lost |
| Expectancy | Average result per trade, wins and losses together. The single most honest number |
| Payoff ratio | Average win ÷ average loss. Above 1 means your wins are bigger than your losses |
| Max drawdown | The deepest fall of your equity curve from a high |
| Average hold | How long you usually keep a trade open |
How the score works
The score adds up four things: your win rate, your profit factor, how well you contained drawdowns, and how many trades you have closed (a score from 3 trades means little). 85 and above is A+, 70 is A, 55 is B, 40 is C. It is a learning aid, not a ranking.
Insights in plain words
The What your trades say card picks out patterns such as "your long trades win 66% of the time, your shorts 58%", "Wednesday is your best day; Sunday costs you the most", "trades closed within 5 minutes win only 30%" or "three losses in a row, a short break often helps". Each is computed from your own trades.
How to use it each week
- Pick 7 days and read the insights card.
- Check the equity curve: is the drawdown shaded area growing?
- Look at How long you hold and Hour you opened the trade. Cut what costs you.
- Write one lesson in your trade journal and test a rule for it in Pro Chart.
Key takeaways
- A score, curves and insights from all your trades.
- Expectancy and payoff matter more than win rate alone.
- Review weekly with the 7-day filter.
- Pair it with the trade journal and Pro Chart.
Summary in Nepali (नेपालीमा सारांश)
My Analysis ले तपाईंका सबै बन्द ट्रेडबाट १०० मध्ये ट्रेडर स्कोर, equity curve, drawdown, कुन दिन र कुन समय राम्रो, कुन शेयरमा फाइदा र तपाईंको बानीबारे सजिलो भाषामा सुझाव देखाउँछ। हरेक हप्ता ७ दिनको फिल्टरले समीक्षा गर्नुहोस्।
See your report card
StockYatra is free on the App Store and Google Play. Already installed? The October update arrives automatically the next time you open the app. You start with 10,000 free virtual coins; prices are simulated and coins are never real money.
More from the October update
- Everything new in the October 2026 update
- Pro Chart: 41 strategies, backtested on your chart
- Pine Script in the StockYatra app
- Build your own trading strategy without code
- Global chat is back
- 100 new courses in English, Nepali and Hindi
- Pro Chart: all 41 strategies
- Full changelog
StockYatra is an education app, not a broker or adviser. Prices on its practice market are simulated around each stock's real-world level, coins are virtual, and nothing here is a recommendation to buy or sell any security. Backtests describe the past and do not predict future results.