In short
- A backtest runs fixed rules over past prices to see how they would have behaved.
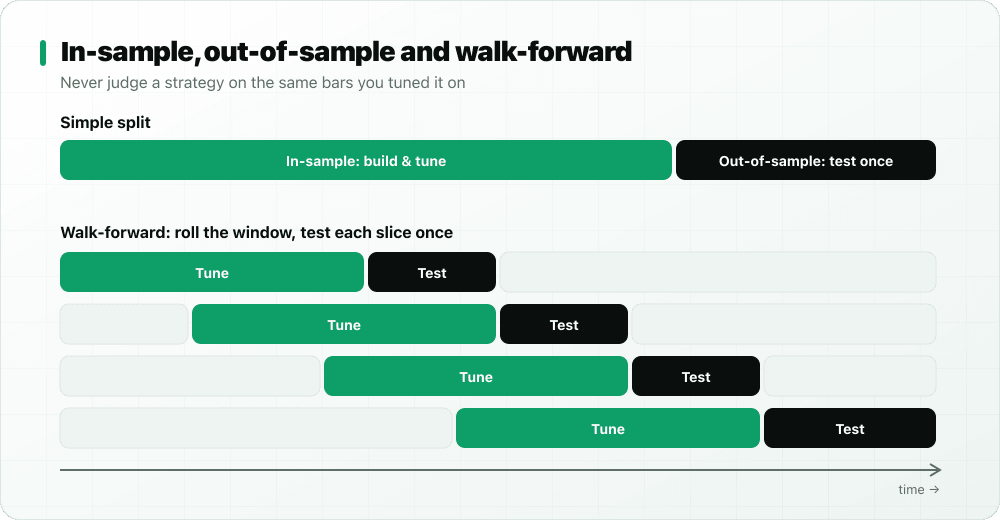
- Split your data: build and tune on one part (in-sample), judge once on another (out-of-sample).
- The six classic traps: overfitting, look-ahead bias, survivorship bias, ignoring costs, too few trades and keeping only the lucky idea.
- In our worked example, the best of 41 strategies in-sample fell to a small loss out-of-sample.
Every trading strategy looks good on the chart its author chose. A backtest is meant to replace that impression with numbers: how many trades, how many winners, how deep the worst drop, how much after costs. Done well, it saves you from strategies that never worked. Done badly, it gives false confidence.
What a backtest is (and is not)
A backtest takes rules that are fixed in advance ("buy when X, sell when Y, risk Z") and applies them to historical bars, one at a time, as if you were trading then. It is not a forecast. It tells you how the rules behaved in that period, which is useful only if the period resembles what comes next and if the test was honest.
Step by step
- Write the rules completely: entry, exit, stop-loss, position size, which bars, which instruments. No discretion.
- Choose the data and the timeframe. Keep part of it aside and do not look at it yet.
- Include costs: commission, spread and slippage on every entry and exit.
- Run it in-sample and read every number, especially the bad ones.
- Tune sparingly. Every setting you adjust is a chance to fit noise.
- Run it once out-of-sample. This is the real exam. If it fails here, it failed.
- Repeat with walk-forward windows and on other instruments to see if the result is stable.
- Paper trade it live before risking anything.
The numbers that matter
| Metric | What it tells you | Watch out for |
|---|---|---|
| Net return vs buy & hold | Whether the rules beat simply holding | A small edge that vanishes after costs |
| Number of trades | Whether the result means anything | Fewer than about 30 trades says very little |
| Win rate | How often trades win | High win rates can hide rare, huge losses |
| Profit factor | Gross profit ÷ gross loss | Values near 1 mean costs decide everything |
| Maximum drawdown | The worst peak-to-trough drop | Whether you could live through it for real |
| Average trade | Expected result per trade | Must be clearly above round-trip costs |
Six ways a backtest lies
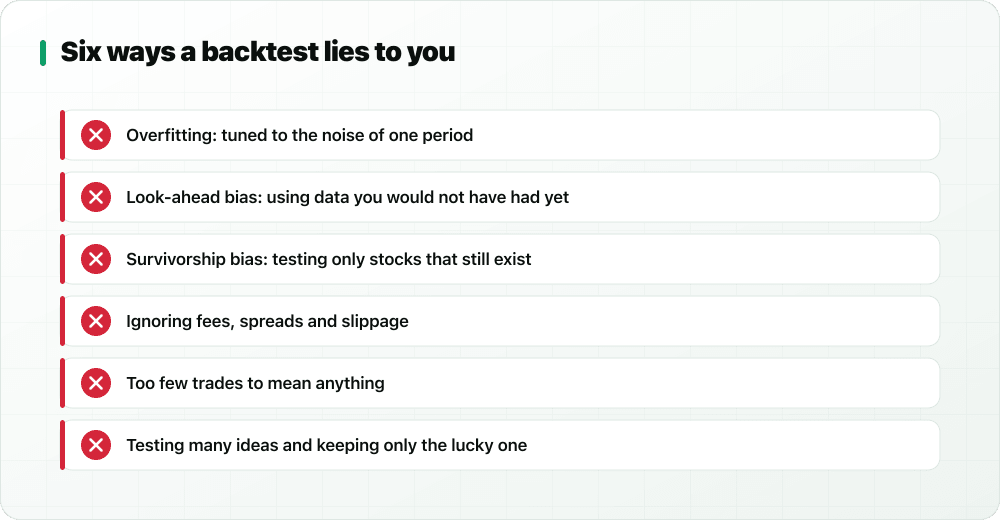
- Overfitting. Tuning ten settings until the curve is smooth fits the noise of that period. More parameters, more danger.
- Look-ahead bias. Using information you would not have had at the time, such as a day's close to decide a trade at that day's open.
- Survivorship bias. Testing only today's listed companies ignores the ones that collapsed or were delisted.
- Ignoring costs. Strategies that trade often are the most sensitive to fees and slippage.
- Too few trades. Five winning trades in a row can be luck.
- Data snooping. Test fifty ideas and one will look brilliant by chance. Keeping only that one and forgetting the other forty-nine is self-deception.
A worked example with real numbers
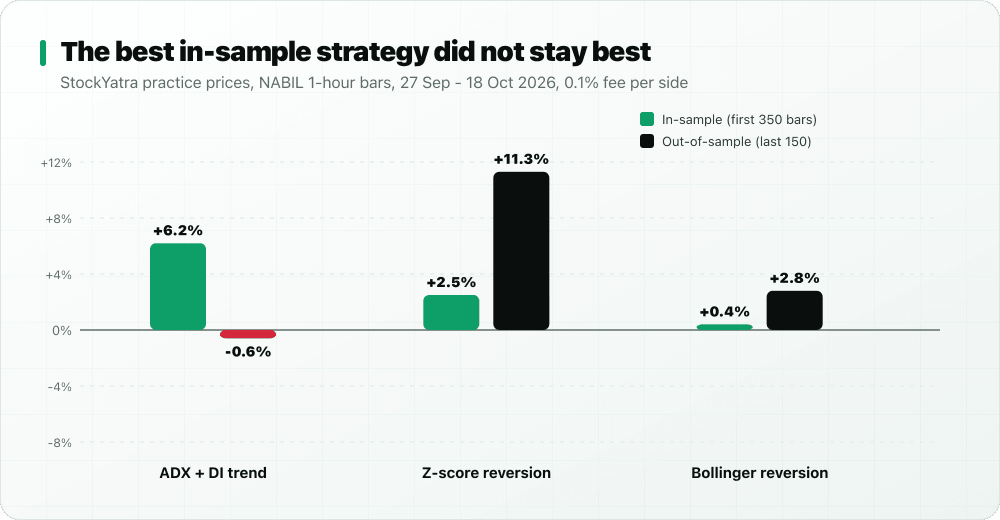
To show these traps in action, we ran all 41 strategies in StockYatra's Pro Chart, using the app's own strategy and backtest code with default settings and a 0.1% fee per side, on the practice (simulated) price series of NABIL, 1-hour bars, 27 September to 18 October 2026 (500 bars). We ranked them on the first 350 bars (in-sample), then looked at how the same rules did on the last 150 bars (out-of-sample) without changing anything.
| What we measured | Result |
|---|---|
| Strategies that made at least one trade in-sample | 38 of 41 |
| Buy & hold, in-sample / out-of-sample | −0.7% / +1.1% |
| Best in-sample: ADX + DI trend | +6.2% on 6 trades → −0.6% on 1 trade out-of-sample |
| Second: Z-score reversion | +2.5% on 7 trades → +11.3% on 4 trades |
| Third: Bollinger reversion | +0.4% on 7 trades → +2.8% on 3 trades |
| Average out-of-sample result of all 38 | −12.3% |
| Profitable in-sample / out-of-sample | 3 / 3 |
| EMA crossover on all 500 bars, fee 0% / 0.1% / 0.3% per side | −36.3% / −39.3% / −44.9% (24 trades) |
What this shows:
- The ranking did not survive. Picking the in-sample winner would have picked a strategy that lost on new data.
- Trade counts were tiny. Six, seven, four trades: far too few to separate skill from luck. A real study needs much more data.
- Most rules lost money on this noisy series. The average out-of-sample result was −12.3% while simply holding gained 1.1%.
- Costs add up. The EMA crossover lost before fees because it was whipsawed; each extra 0.1% of fee on 24 round trips made it worse.
Run your own, honestly
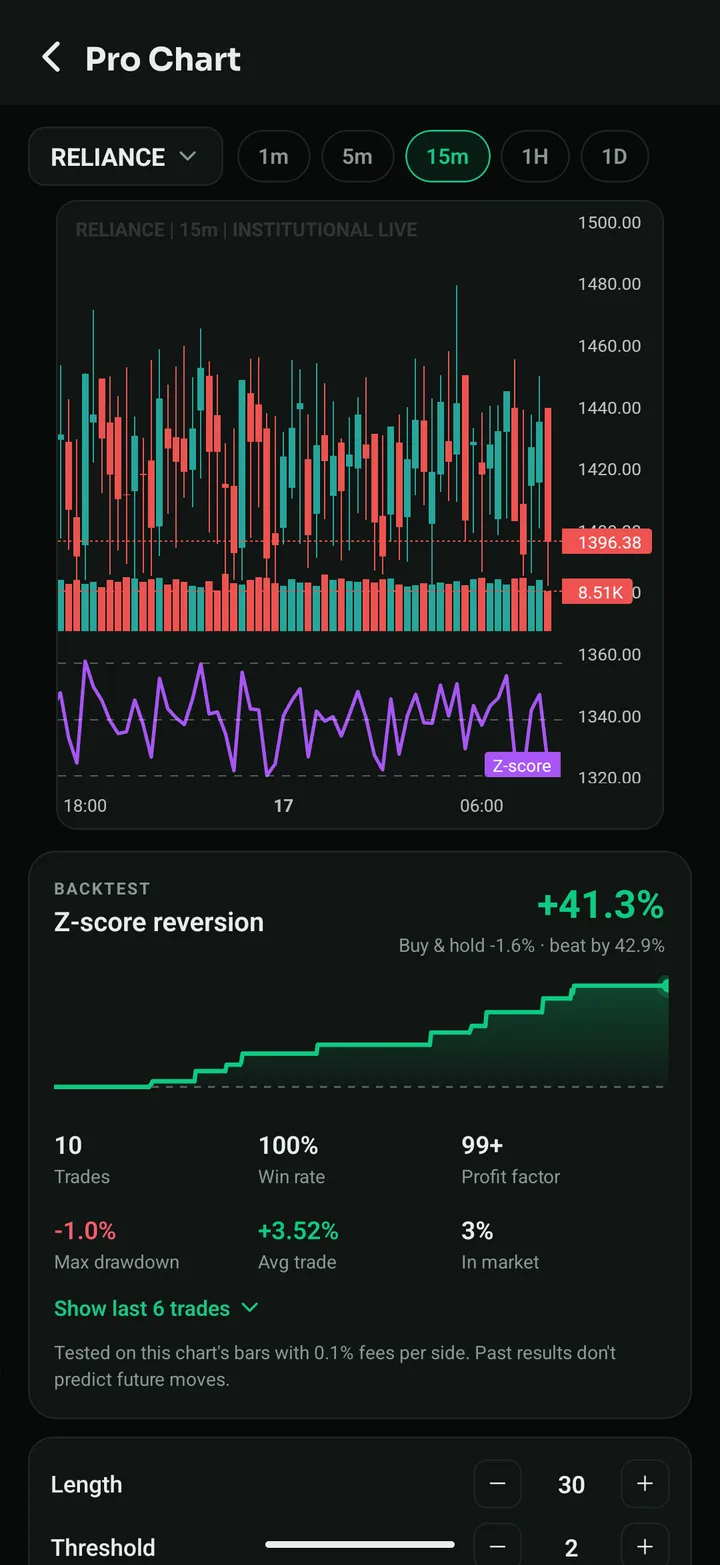
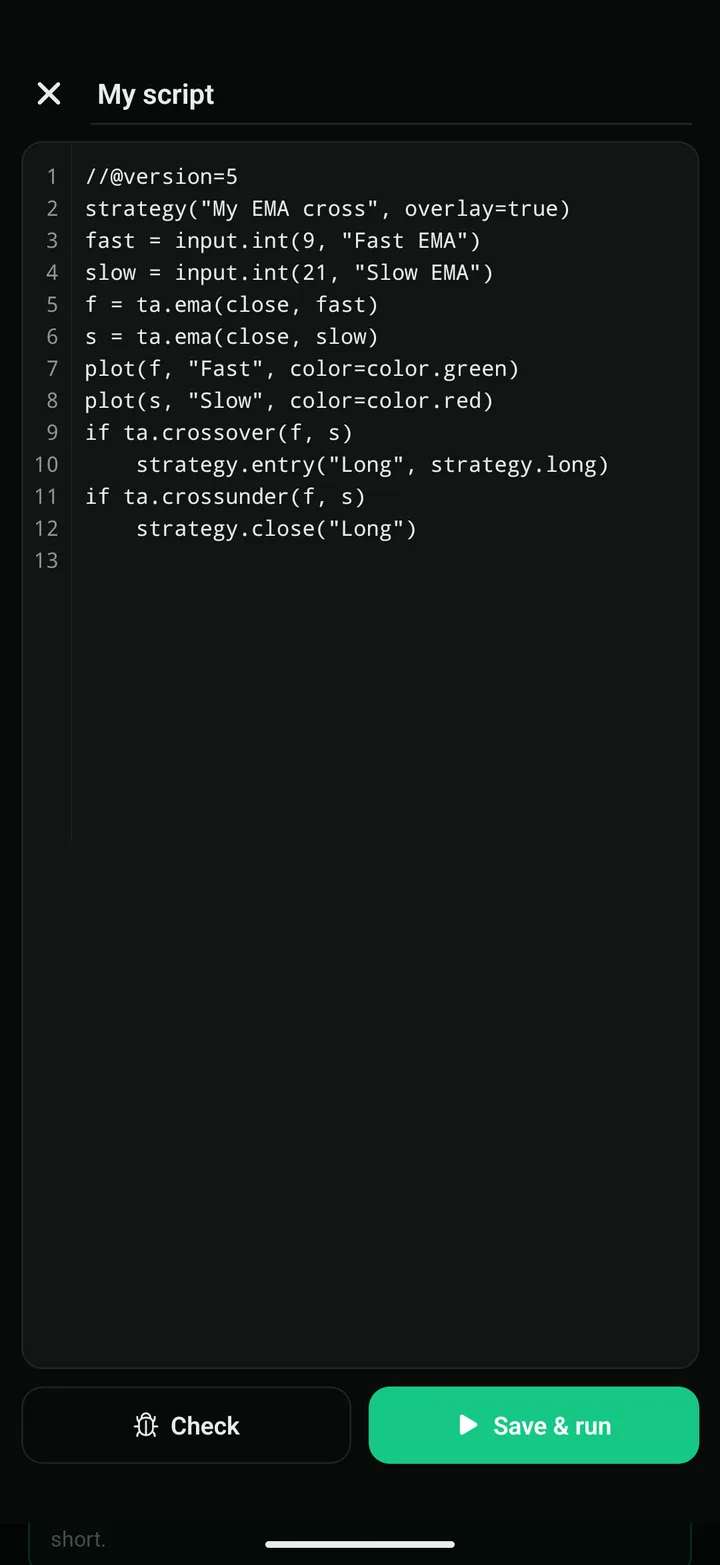
In the StockYatra app, Pro Chart backtests every strategy on the chart you are viewing, with a 0.1% fee per side, and shows return against buy & hold, number of trades, win rate, profit factor, maximum drawdown and in-market time, plus the last trades. Try the same strategy on different stocks and timeframes (NEPSE, NSE, US), change one setting at a time, and write your own in the no-code builder or Pine Script. Then paper trade it with virtual coins before you trust it.
Key takeaways
- Fix the rules first, include costs, and keep data aside for an out-of-sample test.
- Read the bad numbers: drawdown, trade count, average trade after costs.
- Overfitting, look-ahead, survivorship, costs, small samples and data snooping all flatter the past.
- In our example the in-sample winner lost on new bars.
- Paper trade before you trust any backtest.
Backtest strategies on real charts, free
StockYatra is a free practice app for Nepal (NEPSE), India (NSE) and US stocks. Test 41 transparent strategies, write rules without code or in Pine Script, and backtest them on the chart with virtual coins. Nothing connects to a broker and nothing is real money.
The algo trading series
- What is algorithmic trading?
- Algo trading in India: the 2026 rules
- Is algo trading allowed in Nepal?
- Classic algo trading strategies, explained
- Algo trading vs manual trading
- How to start algo trading as a beginner
- Algo trading: the one-page guide
- Black box AI trading, explained
- Pro Chart: 41 strategies with every rule shown
StockYatra is an education app, not a broker, adviser or research analyst. Nothing here is a recommendation to buy or sell any security, to use any trading product, or legal advice. Rules and dates are summarised for learning; check the regulator's and your broker's current notices before acting. Practice prices are simulated and coins are virtual.