In short
- Alert platforms scan US markets for unusual volume, large options orders and off-exchange trades.
- An alert says something unusual happened. It does not say why, or what happens next.
- A big options order can be a hedge, a spread leg or a closing trade, not a bet.
- Use alerts to find charts worth studying, then decide with your own rules.
In the US, "black box" is closely tied to real-time alert platforms (one of the best known is literally called Blackbox) that scan every stock and option for activity that looks unusual. Their dashboards are fast and exciting, and they are easy to misread.
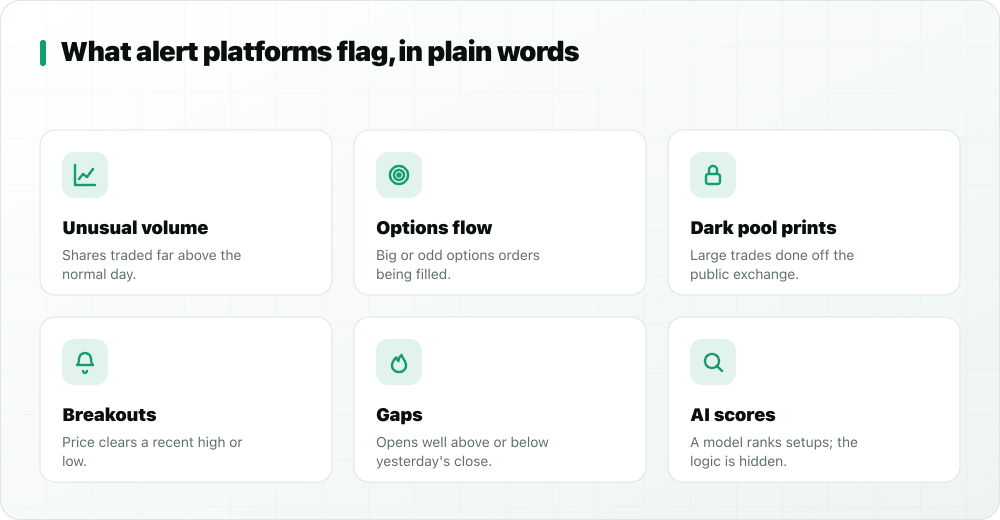
What each alert means
| Alert | What happened | What it does not tell you |
|---|---|---|
| Unusual volume | Many more shares traded than on a normal day | Whether buyers or sellers were in control, or why |
| Options flow / unusual options activity | Large or unusual options orders were filled, sometimes far from the current price | Whether it is a fresh bet, a hedge, one leg of a spread or someone closing a position |
| Dark pool prints | A large block traded off the public exchanges and was reported afterwards | Which side started it; many are routine institutional trades |
| Breakouts and gaps | Price cleared a recent high or low, or opened far from yesterday's close | Whether the move will hold or fade |
| AI score / ranking | A model rated a setup as promising | Which features drove the score, which is the black-box part |
Why beginners misread alerts
- Assuming direction. A big call purchase looks bullish, but it might hedge a short stock position elsewhere.
- Chasing late. By the time an alert reaches you, fast traders have often moved the price.
- Too many signals. Hundreds of alerts a day guarantee that some will "work", which feels like proof but is not.
- Ignoring risk. Following an alert with no stop-loss or position size turns a scan into a gamble.
A simple way to use alerts
- Treat the alert as a shortlist.
- Open the chart: trend, support and resistance, where volume came in.
- Apply a rule you already tested, for example a breakout above a range with volume above its 20-day average.
- Decide your exit and size before entering.
- Record the result, alert or not, and review weekly.
Practise reading volume and breakouts
You can build the core skill, reading price and volume together, without any subscription. StockYatra's practice market includes US stocks such as AAPL, MSFT and NVDA alongside NSE and NEPSE. Pro Chart has transparent volume and breakout strategies (Volume breakout, Donchian / Turtle, Keltner breakout, OBV trend and more) that draw every signal and backtest it, so you can see how often "unusual volume" actually led anywhere. StockYatra does not offer options trading; the skills here are about reading the underlying stock.
Key takeaways
- Alerts describe unusual activity, not intent or outcome.
- Options flow and dark pool prints have many innocent explanations.
- Use alerts as a shortlist, then decide with tested rules and set risk first.
- Practise reading price and volume before paying for any scanner.
Practise reading price and volume
StockYatra is a free practice app for Nepal (NEPSE), India (NSE) and US stocks. Test 41 transparent strategies, write your own rules or Pine Script, and backtest them on the chart with virtual coins. Nothing is hidden and nothing is real money.
The black box AI series
- What is black box AI in trading?
- SEBI rules: white box vs black box algos
- AI trading bot scams: 10 red flags
- Black box or white box: where beginners should start
- Can AI predict the stock market?
- Black box AI trading: the one-page guide
- Pro Chart: 41 strategies with every rule shown
StockYatra is an education app, not a broker, adviser or research analyst. Nothing here is a recommendation to buy or sell any security or to use any trading product. Rules and dates are summarised for learning; check the regulator's and your broker's current notices before acting. Practice prices are simulated and coins are virtual.