In Short
- Backtesting replaces emotional guesswork with mathematical probabilities and historical evidence.
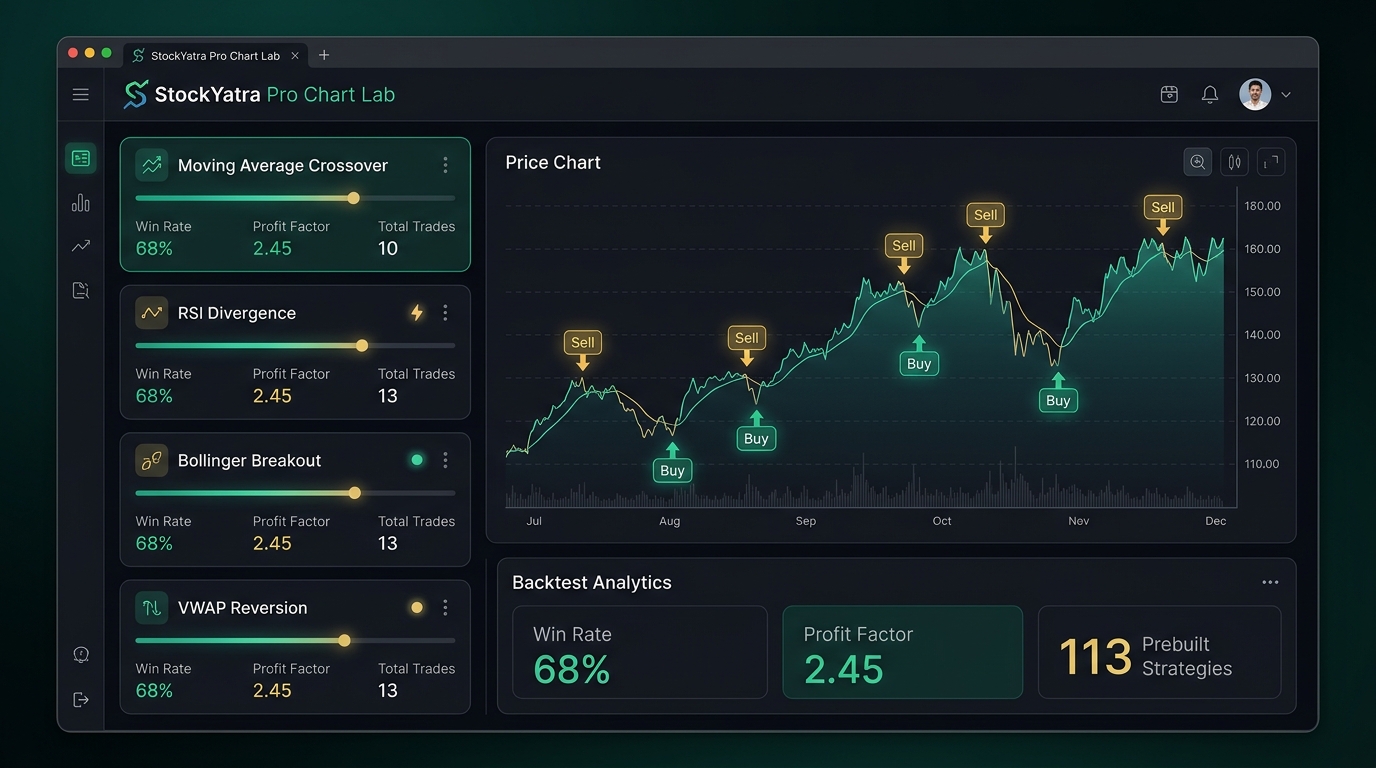
- StockYatra Pro Chart Lab unlocks all 113 prebuilt algorithmic trading strategies across 7 market regimes.
- Auto-Tune searches for optimal indicator parameters and risk rules for individual stocks.
- Lumi AI provides up to 50 daily on-demand chart breakdowns in Nepali, English, and Hindi.
The single greatest cause of retail trader failure is trading unverified ideas. A beginner sees a green candle, reads a rumor on social media, and jumps into a position without knowing if that setup has a positive mathematical expectancy over 100 iterations.
Quantitative traders do the opposite: before risking a rupee, they simulate the strategy across years of historical price candles to determine its Win Rate, Profit Factor, and Maximum Drawdown. The StockYatra Pro Chart Lab puts this quantitative power into your hands.
1. The 113 Prebuilt Strategy Matrix
While free members can test 10 classic strategies, StockYatra Pro unlocks the complete library of 113 proven trading strategies covering every market environment:
- Trend Following: Exponential Moving Average (EMA) crossovers, Supertrend, Parabolic SAR, and Donchian Channel breakouts.
- Momentum & Oscillators: RSI Divergence, Stochastic crossovers, and MACD histogram zero-line turns.
- Mean Reversion: Volume-Weighted Average Price (VWAP) bands and Bollinger Band squeeze reversals.
- Candlestick Formations: Automated detection of Bullish Engulfing, Morning Star, Pin-bars, and Three White Soldiers.
2. Interpreting Your Backtest Analytics
When you run a strategy in the Lab, StockYatra instantly computes four key metrics:
- Win Rate (%): The percentage of closed trades that resulted in a net gain.
- Profit Factor: Gross profits divided by gross losses. A profit factor above 1.5 indicates a healthy, resilient strategy.
- Maximum Drawdown (%): The deepest peak-to-trough decline in portfolio equity. Keeping drawdown low is critical for long-term survival.
- Total Trade Count: Ensures your sample size is statistically significant (minimum 30+ trades recommended).

3. Lumi AI: Your 24/7 Personal Chart Mentor
Have you ever looked at a complex NEPSE chart and wondered if you were missing a key resistance zone? Pro members get 50 daily queries with Lumi AI (compared to 10 on the free tier).
Lumi acts as your co-pilot: ask questions in Nepali, Hindi, or English like "What is the key support for NICA?" or "Explain this RSI divergence pattern", and receive instant, objective analysis tailored to your current view.
4. Step-by-Step: From Backtest to Practice Execution
- Select a Stock: Open any stock chart on NEPSE, NSE, or US markets.
- Choose a Strategy: Open Pro Chart Lab and select a strategy suited for the current regime (e.g., Trend Following for a bull run).
- Review Analytics: Inspect the Win Rate and Profit Factor over the past 12 months.
- Run Auto-Tune: Optimize stop-loss and take-profit ratios to minimize drawdown.
- Execute with Virtual Coins: Apply the proven setup in your practice portfolio with automated alerts.